Background
Nowadays antenna simulation software and powerful computers are available to radio amateurs. It is easy to study computer models of different antennas and also to optimise antennas within the computer model.Like all models, antenna simulation models have limited accuracy and it is not so easy to know how accurately the models will describe real antennas. The best computer program available to amateurs is NEC2. The documentation describes how various integrals are calculated from series expansions, and it explicitly states that the error caused by neglect of higher order terms is in the order of 1%. Errors of this order of magnitude occur at severa l places, and it is not self evident how different errors add or maybe cancel each other.
For VHF frequencies the yagi antenna is by far the most economic way of producing high gain. Yagi antennas depend on very high currents flowing on the elements in such a way that the the radiation from the individual elements cancel in all directions (more or less) except in the forward direction. Not even in the forward direction the radiation adds in phase from all elements. The contributions to the electromagnetic far field from the different elements are phase shifted in such a way that adding some more phase shift by moving away from the forward direction will reduce the sum quickly.
Since the yagi depends on cancellation of the radiation from the different elements, it is difficult to guess how an error in the 1% (or a few %) range will influence the agreement between the model and a real antenna.
The main objective of the antenna measurement excercise at +s 1997 was to try to get accurate information on the differences between computer simulations with NEC2 and real radiation patterns from yagi antennas.
This information is needed to design a real, highly optimisedlong yagi for 70 cm. Low G/T (good suppression of spurious lobes) is very importanton 70 cm, so accurate calculation of how the radiation from the different elements cancel is nessecary.
Optimisations using NEC2 indicate that very high gain can be obtained simultaneously with very low noise temperatures. When the power gain of a single yagi is 20 dBi (dB compared to an isotropic radiator) the average suppression of unwanted radiation has to be well above 30 dB. NEC2 indicates this is possible.
We may compare to an idealised antenna having 0 dB receive sensitivity in a forward lobe covering 0.5% of the total 4 pi solid angle,and -23 dB in all other directions. Such an antenna has 20dBi gain, and 50 % of the power is in the main lobe while 50 % is in the 200 times weaker, but 200 times larger area outside the main lobe.
This idealised antenna is useless for receive since the ground is about 10 times warmer than the sky. To make ground noise and sky noise give equal contributions, the average suppression has to be increased by a factor 5, to 30 dB. (The ground covers 2 pi solid angle). To make the sky noise dominate we need another 6 dB or so.
In other words, if low noise, very high gain 70 cm antennas are desired,it is nessecary to use a computer model that reproduces the cancellation of radiation from the different elements of a yagi down to about -40 dB. The 1997 antenna measurements at the Scandinavic VHF meeting is an attemptto investigate if NEC2 is accurate enough.
As a side effect, some accurate gain figures have been obtained.
Plane of measurement
For a yagi antenna, the significant radiation pattern is the H-Plane. (A vertically polarised antenna, rotated around a vertical axis) This is not the popular plane for antenna measurements becausethe measurement is slightly more difficult than rotating a horisontally polarised antenna around a vertical axis.The reason why the H pattern should be measured is that the E pattern easily is obtained from the H pattern by multiplication with the radiation pattern of a half wave dipole. It is not possible to calculate the H pattern from the E pattern in directions that are nearly parallell to the elements becausethe H pattern is the E pattern divided by the dipole pattern. Division by zero is always problematic...
Another way of explaining the same thing is to say: If one measures the E pattern only, very strong lobes perpendicular to the boom willnot be detected. All measurements have a limited dynamic range due to reflections and very good measurement sites are needed to properly see the signals from 60 to 120 degrees in the E plane. In this region of angles it is very difficult to avoid reflected signals entering through the main lobe, and the measured pattern is usually not really the antenna characteristics.
As an example, look at the measured radiation pattern of the K1FO antenna in fig. 1.
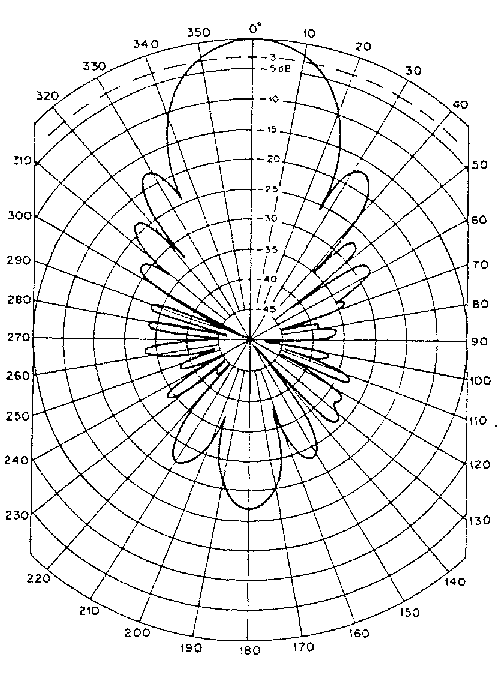
Fig 1. Experimental radiation pattern for the K1FO 22 element yagi.
Measured by K1FO (10/2/86).
Reprinted with permission from the 1994 ARRL Handbook.
This diagram shows that the K1FO 22 element design is a good antenna. But does it really show how good it is ? The small lobes are not equal on both sides, so they are most probably caused by reflected waves. Fig. 2 shows the same radiation pattern measurement with the left and the right side on top of each other in different colours.

Fig 2. Same measurement as in fig. 1 shown differently. The left side in black, and a mirror image of the right side in red.
Since the K1FO antenna is a good design with side lobes well below -15dB, the measurement of the sidelobe level is difficult. The left and the right side lobe level differ by about 1 dB at the peak and by as much as 5 db at about 37 degrees as can be seen from the figures.
We may explain the differences as reflected waves.
                            32 deg               37 deg.
                         Left   Right         Left  Right
        Level (db)       -18     -17          -25    -20
        Level (Volt)    0.126   0.141        0.056  0.100
The amplitude of the reflected wave (in Volts) has to be somewhere in the region 0.02 to 0.04. It may be a little stronger, we do not know the phase relation, so voltages do not nessecarily add right on. A value of 0.04 in the Volt scale corresponds to nearly -30dB. It is difficult to arrange a measurement site much better than this, and any information about radiation below -20dB compared to the main lobe has to be regarded with a lot of suspicion.
The lobes at 90 +/- 8 degrees are at about -35 dB. The values for the H pattern become about -15 dB by division of the dipole pattern. Of course this value for the H pattern is incorrect. Below -25dB the measurement is completely unreliable. Still, as described above, the quality of the antenna greatly depends on suppressing small lobes very well, far below -25dB.
Difficulties
We want to have information about fields down to 40 dB below the field in the forward direction. With a conventional setup this is not easy (understatement). Very high towers would be needed.The distance between the antenna to be measured and the fixed antenna has to be 50 meters or more if we want to measure far field patterns. Houses, threes and other objects have to be far away to not produce reflections above the -40 dB level. Even very large areas without any visible object may cause reflections due to structures under ground.
A previous attempt to measure radiation patterns accurately at a professional site failed because the reflected waves were about 20 dB too strong. Attempts to include the reflected waves failed because there were too many reflection points, and the amplitude of the reflected waves was varying with frequency.
Measurement method used at the Nordic VHF Meeting, Öland 970606
The Antenna Under Test (AUT) was mounted on a horizontal non-conducting boom about 3 m out from a pneumatic tower at a height of 10 m above ground. The AUT was rotated in elevation in angles from 0 to 360 degrees. The polarization was horizontal. This is a setup for the H plane pattern - which is one of the requirements.

The measurement setup used at VHF97 in +s, Öland.
Amplitude and phase were measured at a distance of about 60 m (height=7 m). The counter antenna was a Vårgårda 6el 144MHz and a Vårgårda 6el 432MHz, respectively.
With this setup, a very strong ground reflection is present. It is in the order of 6 dB below the direct wave. As seen from the AUT, the reflection comes from an angle of about -17 degrees. Most of the antennas have wider opening angles than that, but since there is only one, well defined reflection, it is possible to evaluate the amplitude and the phase for the reflected wave.
The important feature with the measurement setup is that it allows accurate measurements in the range 60 to 120 degrees. At these angles, the main lobe points into the sky. The back lobe, and all small lobes may produce reflections from the ground. Since measurements were also made with the main lobe in the corresponding directions we can make sure that reflections from possible hidden structures under groundare weak. Of course all small lobes are disturbed by the ground reflection at -17 degrees. The measurement gives the sum of two radiation patterns which differ by 17 degrees in angle and about 6 dB in amplitude. The patterns are added with some varying phase - that has to be evaluated.
The direct data for 17M2, conventionally plotted, are shown in fig. 3 for a single frequency (144MHz). The number of points is not very large, and by looking at fig. 3 only no useful information can be obtained.
By joining the points with straight lines, as is done in fig. 4, the polar graph looks more informative - but it is not really so. The place where minima and maxima are located are easier to see but the shapes of the lobes are seriously incorrect.
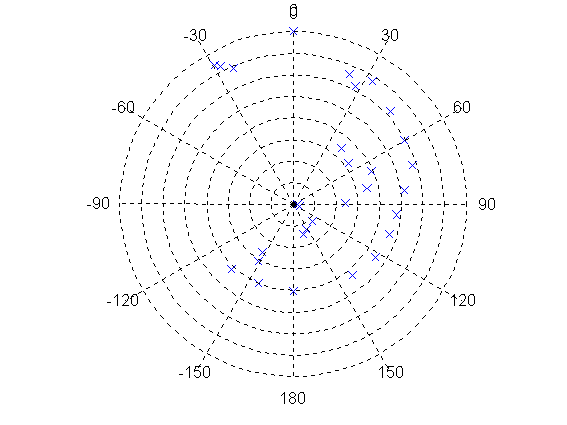
Fig 3. Radiation pattern of 17M2. Raw data points for 144MHz. The scale is normalized with 0 dB in the forward direction, 5 dB/div.
Minimum (origin) is -40 dB.
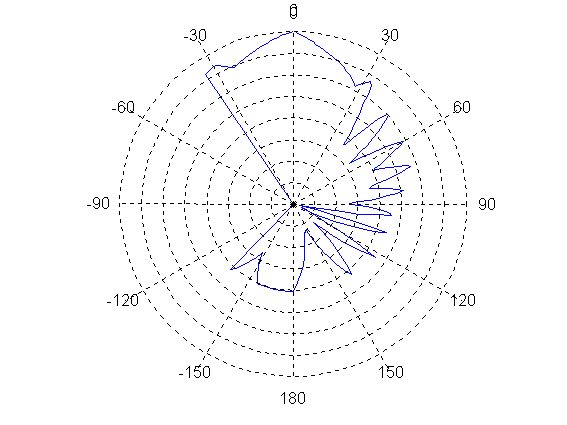
Fig 4. As fig 3 but with straight lines drawn between the measurement points. (The lines are straight in linear power scale)
First Step of Evaluation. Reorganisation of Data
Phase and amplitude was measured at 51 frequencies for each antenna at a large number of different angles. The previously presented raw data files contain a few trivial errors caused by the scanning from paper to ascii files and a serious error for the SM5BSZ 26 element antenna, for which a few files were incorrecly named, causing a "impossible to explain" radiation pattern. The file names contain the angle for each measurement series of 51 frequencies.The corrected raw data files are packed into .ZIP files together with some additional measured data and antenna dimensions in the form of input files for NEC2. These files should be unpacked in separate subdirectories since they contain different files with identical names. Some parameter files needed by later on are also included in these .ZIP files so they automatically become unpacked in the correct subdirectories.
The subsequent steps assume each antenna is in its own directory, and the directory names are used in the text files controlling program flow.
K1FO.ZIP
VARG13.ZIP
BSZ26.ZIP
VARG9.ZIP
17M2.ZIP
BSZ9.ZIP
The evaluation process is divided into a series of steps, each performed by a FORTRAN program. The measurements are not difficult, but the evaluation procedure is complicated. By splitting the evaluation process into several steps, it is easier to verify that the computer program is doing what it is intended to do. The intermediate results are written as ascii files, and can be inspectedas graphs by MATLAB.
The first step is to bring the data into a more convenient form. The information from all the raw data files is brought together to one file for each antenna. These files, CMPLXAMP.TXT, are normalised and the phase reference point is moved backwards. For full information, source code and a .EXE file look at STEP1. To illustrate the meaning of the first step, fig. 5 to fig. 8 are shown below. Figures 5 and 6 show the complex amplitude as a function of frequency in the forward and in the back direction. These graphs are just the raw data files 0000.DAT and 1800.DAT from the 17M2.ZIP file. The files contain level in dB and phase angle, and the graphs show the data converted to linear voltage scale. The voltage is a complex value, so it is shown as two curves, one for the real part and another for the imaginary part.
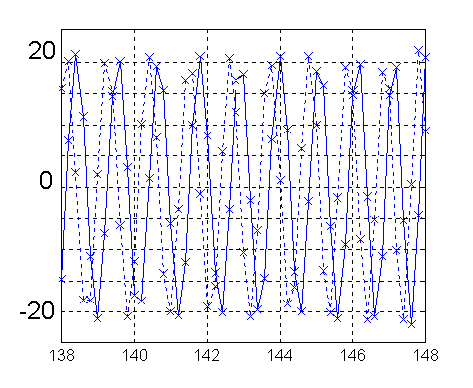
Fig 5. Raw data for 17M2 in the forward direction. (File 0000.DAT in 17M2.ZIP) The vertical scale is volts and the horizontal is frequency. The two curves show the complex voltage in the far field as real and imaginary parts.
Straight lines are drawn between the measured points marked by x. Note that the straight lines do not represent the real curves which are very close to two sine curves with 90 degree phase shift.
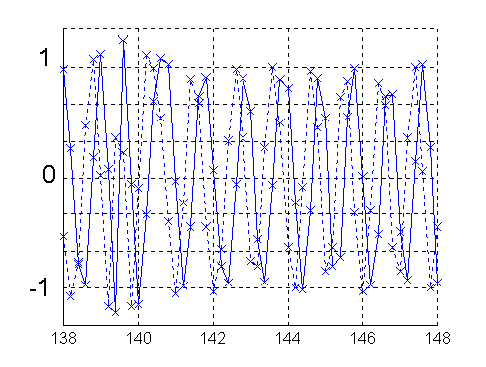
Fig 6. Raw data for 17M2 in the back direction. (File 1800.DAT in 17M2.ZIP) Complex voltages as in fig 5.
The measurement of phase and amplitude was done with a network analyser. The phase angle is the phase angle between a reference signal that was sent through a short cable from the signal source to one of the analyser inputs and the signal from the AUT. The reference signal travels only a few meters but the the signal from the AUT travels through long cables and about 70 meters as free waves.
As can be seen from fig. 5 and 6 the phase turns 360 degrees when the frequency is chanhed by about 1MHz. If we had used a cable for the reference signal that would have delayed the reference signal with the same amount as the signal from the AUT was delayed due to cables and free wave propagation, the complex amplitude curves would look much more informative (although they would represent the same information).
Rather than using very long cables, we can easily add a delay in the reference signal afterwards which is equivalent to add a phase change that is proportional to the frequency.
The first step produces the files CMPLXAMP.TXT that contain the raw data in a convenient form as if they had been measured with a long cable for the reference signal having approximately the same time delay as the signal from the AUT. Figures 7 and 8 show the same data as figures 5 and 6. By bringing the measured data into this form it is much easier to visually compare experimental data with computer simulations.

Fig. 7 Measured far field for 17M2 in the forward direction. Same data as in fig. 5 but the reference phase is compensated with a time delay. The vertical scale is volts and the horizontal is frequency. The two curves show the complex voltage in the far field as real and imaginary parts.
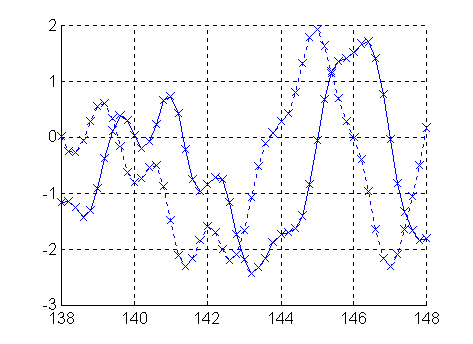
Fig. 8 Measured far field for 17M2 in the back direction.
Same data as in fig. 6 but the reference phase is compensated with
a time delay.
The vertical scale is volts and the horizontal is frequency.
The two curves show the complex voltage in the far field as real
and imaginary parts.
Just a quick look at figure 8 shows something that is impossible to detect with a conventional radiation pattern measurement. Note that the measurements at 0 and 180 degrees correspond exactly to two points in the conventional measurement setup when a horizontally polarised antenna is rotated around a vertical axis.
At 180 degrees, the phase function contains an oscillation with a period of about 1.75MHz. It is absolutely impossible that such a structure can be produced by an antenna only a few wavelengths in size. These oscillations have to be because of a reflection from behind.
When the antenna is at 180 degrees, the main lobe is parallel to the main lobe of the fixed antenna, and any object behind the measurement site will cause reflections. The 1.75MHz period means that the reflection coming in at 180 degrees has travelled one more wavelength each time the frequency is increasedby 1.75 MHz. The corresponding distance to the reflecting object is 86 meters.
The amplitude of the reflection is approximately 0.8 units in the volt scale while the forward lobe has an amplitude of 18 units (140MHz) The amplitude of the reflected wave behind is thus -27dB compared to the direct wave from the fixed antenna. When only power is measured at a fixed frequency, the reflected wave would not be detected and the back lobe level just becomes inaccurate.
Note that the movement of the phase reference point in the first step is not accurate. It is not based on an accurate distance and accurate measurements of cable phase shifts. The phase reference is just brought to a point where the phase of the direct wave is reasonably flat. The arbitrariness of the phase reference has to be taken into account in further evaluation steps.
Second Step of Evaluation. NEC Calculations
The raw data files (above) contain input files in the NEC2 format. With some small changes to the code of OMNEC a program that produces theoretical radiation patterns is obtained. The frequencies are taken from the CMPLXAMP.TXT files produced by STEP1.The theoretical patterns are calculated in 360 points for each frequency and with two slightly different values for a boom correction parameter. The comparision of the patterns with different boom corrections allow a reasonable guess in which direction to find the optimum boom correction. For full information, source code and .EXE files look at STEP2.
Third Step of Evaluation. Computer model.
Starting from the theoretical radiation patterns of STEP2 it is possible to build a model of the whole measurement situation in a computer program. This model calculates the voltage at the feed point as the sum of the voltages produced by the direct wave and a few reflected waves. The strong reflected wave from the ground between the towers is described by a complex reflection coefficient (amplitude and phase). The difference in path length is calculated from tower heights as well as the angle of arrival of the radiation. Weak reflections (from behind) are specified by a distance,height and a complex reflection coefficient.Unfortunately, the center of rotation as well as the the offset of the antenna elements from the center of rotation is a bit uncertain. The wood structure holding the antenna about 3 meters away from the tower was not perfectly stiff and straight. The mounting position, given within 0.01m is really uncertain by perhaps as much as 0.2m. The distance between the towers was never measured. 70 meters is just an estimate. Also the height for the fixed antenna is just an estimate - but the height was the same for 144 and 432 within a few centimeters. For some antennas we even forgot to measure the antenna position (center of rotation).
We are not interested in absolute values for amplitude and phase. The absolute levels are strongly influenced by the feed impedance, which is not so well modeled by NEC2. Each frequency is treated separately. Before comparision, the experimental and the theoretical patterns are both normalised for the average of the radiated power=1. The model also contains an arbitrary phase shift, which changes with antenna and frequency. (But of course, this phase shift is the same for all positions of one antenna)
Reasonable start values for all unknown parameters were found by manual trial and error while looking at graphical presentations of the data. If all positioning data is properly measured, this manual step is not needed, since then the only unknown is the arbitrary phase.
Once a reasonable start guess is found, it is trivial to changethe parameters systematically in small steps in order to improvethe agreement between the parametrised model and the real measurements.
For details of the model and the parameter fitting process, source code and .EXE files look at STEP3.
Comparison of Model and Measured Patterns
The model calculates phase and amplitude at all measured angles and frequencies. The phase relation between the direct wave and the reflected waves is well determined in the model since the model uses the same reflected waves for all antennas. The reflection coefficients are allowed to differ between 144 and 432 MHz. On each band the largest antenna has a narrow enough lobe to partially resolve the main reflected wave at about -17 degrees.The model implies that the ground is a perfectly flat area that produces a perfect image of the counter antenna. This is of course an approximation, and it becomes less good at higher frequencies. As can be seen on the photo, there is a metallic fence below the tower that surely has some influence when the AUT is pointed at it.
The measurements aim at finding the phase and amplitude of all smaller lobes, and some error in the reflected wave(s) will not cause any significant change. The number of small lobes and their phase and amplitude contain information about the current distribution on the antenna elements. The width of the main lobe follows with very good precision. We use NEC2 as a tool to translate the pattern to currents - and then to go from currents to the complete pattern from which the gain figure can be extracted through integration.
The NEC2 program used in STEP2. calculates radiation patterns and step3 finds the "boom corrections" that make the model pattern fit the measurements.
The gain is calculated by integration of the radiation pattern. The directive gain is the forward power density divided by the average power density over all directions. To get the real gain the directive gain has to be multiplied by the efficiency, the radiated power divided by the sum of the radiated power and the power lost in ohmic losses.
The normal way of calculating gain within NEC2 is to calculate the power density in the far field and compare it to the product of voltage and current at the feed point. This method is inaccurate for folded dipoles, probably because the feed impedance is calculated incorrectly within NEC2.
The gain calculated from the radiation pattern within the NEC2 model is much more accurate than the normal gain calculation in NEC2. Particularly since we have made sure that NEC2 uses a boom correction that produces essentially the correct current distribution over the elements. Modest errors in the feed impedance cause minimal changes in the calculated ohmic losses - and the losses have only a small influence on the gain figure. (The losses in a folded dipole are small due to the high impedance so errors do not change the total losses which are dominated by the currents on the directors.)
We know from the measurements that the patterns from NEC2 are pretty close to correct, so it is a safe assumption that the gain figures calculated from those very patterns are close to the real gain.
For a discussion of the results for the different antennas follow the
links below.
The antennas are listed in order of increasing gain.
Explanations and comments are not repeated.
Look at the result for all antennas with lower gain for full information.
Gain values in the list below are at 144.2/432.2
for a rx/tx matched to the true impedance.
VARG9 G = 13.86dBi = 11.72dBd (+0.33dB at 146.2MHz)
VARG13 G = 14.78dBi = 12.64dBd (+0.84dB at 445.2MHz
BSZ9 G = 15.15dBi = 13.01dBd (Max at 144.2)
17M2 G = 16.89dBi = 14.75dBd (+0.019dB at 144.6MHz
K1FO G = 17.87dBi = 15.73dBd (+0.005dB at 434.2MHz
BSZ26 G = ?????
Conclusions
For five antennas we have accurate radiation patterns with associated gain figures. For the high Q antennas 17M2 and BSZ9 some inadequacies of the method can be seen. Most probably the explanation is that the systematic errors within NEC2 can not be compensated with a single "boom correction" over as much as 10 MHz bandwidth for high Q antennas.BSZ26, the very high-Q 70 cm antenna with 26 elements on a 7.5 m boom does not fit at all. The disagreement between the model and the measured data is probably an indication that this kind of yagi needs better simulation than obtainable with NEC2.
If this is the case, the sad conclusion is that we do not yet have a computer model capable of producing truly optimised yagi antennas with boom lengths of 10 wavelengths. Very long yagis still have to be designed for lower Q and more bandwidth with the accompanying loss of gain to make it possible to manufacture antennas that have performance near the performance of the computer model.
Another possibillity is that several angle values are seriously incorrect.
Comparision with other gain data for K1FO
The K1FO antenna is described in the following way in the ARRL handbook: The attention paid to the design process has been worth the effort. The 22-element Yagi not only has exceptional forward gain (17.9dBi), but has an unusually "clean" pattern.The result of our measurement is exactly in agreement with this statement although our pattern differs considerably from the published measurement by K1FO. As explained in the text below fig.2 above this is not surprising. The K1FO antenna is much cleaner than one can possibly measure at a site where the antenna points towards the horizon (and all sorts of reflections) Fig. 10 shows the pattern of K1FO as we deduce it from the measurements superimposed on the experimental data by K1FO.
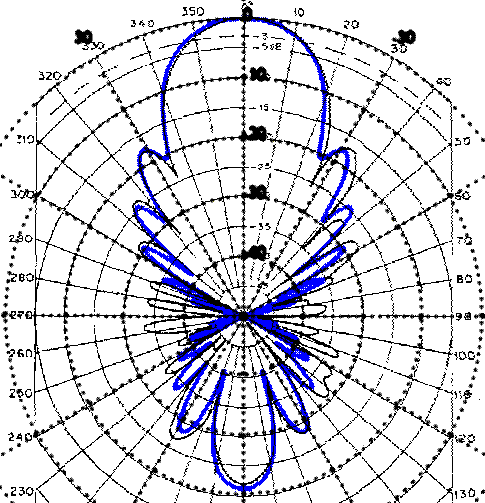
Fig 10. The radiation pattern of the K1FO 22 element design.
The black pattern is fig 1 above and the blue pattern is the
pattern deduced from our measurements
There are good reasons why this antenna is popular for EME !! It is really well designed for weak signal work.
Comparision with other gain data for 17M2
In the study by VE7BQH (DUBUS 1-1996) the gain is given as 14.8dBd at 144.1 MHz in exact agreement with the data we arrive at.There are good reasons why this antenna is popular for EME !! It is really well designed for weak signal work.
Comparision with other gain data for vårgårda9
The manufacturer claims 13 dBd for this antenna for 144-146 MHz Our measurement gives 11.7 at 144 MHz and 12.0 at 146 MHz.This antenna is designed for general usage 144 to 146MHz. At 146 MHz it is equally good as 17M2 or K1FO in gain per boomlength. 12 dBd falls on a straight line with these antennas. 13dB is just impossible for a yagi this size!!
Four of these antennas make a reasonable EME antenna, but it would be desireable to have a weak signal version of this antenna with optimum performance moved 2 MHz down. For satellite work it is well optimised for its size.
Comparision with other gain data for vårgårda13
The manufacturer claims 13 dBd for this antenna for 432-438 MHz Our measurement gives 12.6 at 432 MHz and 13.0 at 438 MHz which is well in line with this specification.Probably the gain is 13.5dBd 10MHz above the amateur band. The fitting of the model is not accurate enough to allow accurate extrapolation so the frequency of maximum directive gain is a bit uncertain.
Leif SM5BSZ wrote the text and the evaluation software.
Niklas SM7UFW made the graphs using MATLAB.
Ulf SM0LCB, Tommy SM7NZB, Danny SM0NBJ and Anna SM5VFS assisted
during the measurement at +s.