K1FO at 432.2 MHz
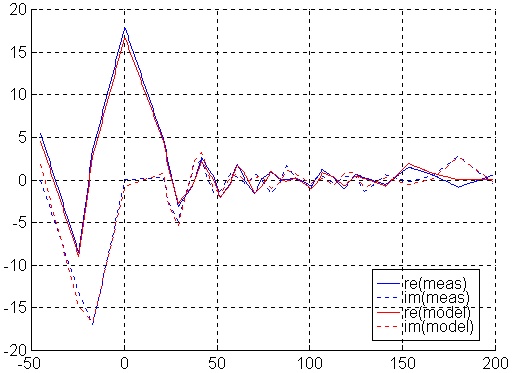
Fig 1. K1FO at 432.2 MHz. The vertical scale is Voltage in arbitrary units. Horizontal is angle in degrees.
The model is in close agreement with the measurement.
K1FO at 436.0 MHz.

Fig 2. K1FO at 436.0 MHz. The vertical scale is Voltage, same units as in fig 1. Horizontal is angle in degrees.
For this antenna 4MHz does not make much difference, this figure is similar to fig1.
The back lobe of K1FO.
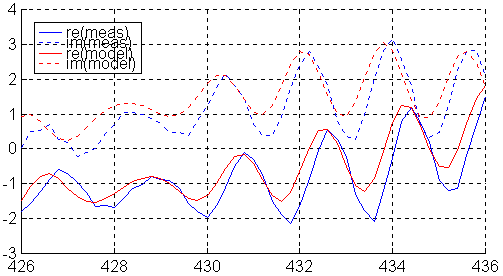
Fig 3. The back lobe of K1FO. The vertical scale is Voltage, same units as in fig 1. Horizontal is angle in degrees.
K1FO magnitude of error at all frequencies and directions
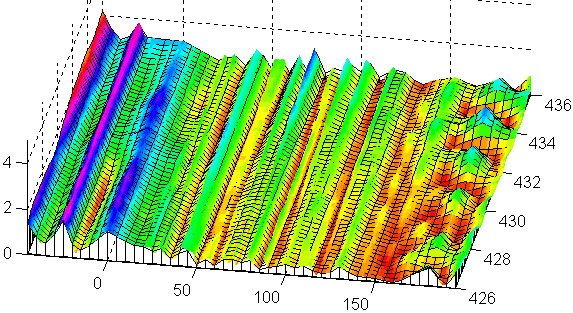

Fig 4. K1FO magnitude of error at all frequencies and directions. The vertical scale is Voltage, same units as in fig 1. Horizontal are angle and frequency.
The errors are small and do not change much with frequency.
K1FO real part of far field at all frequencies and directions.
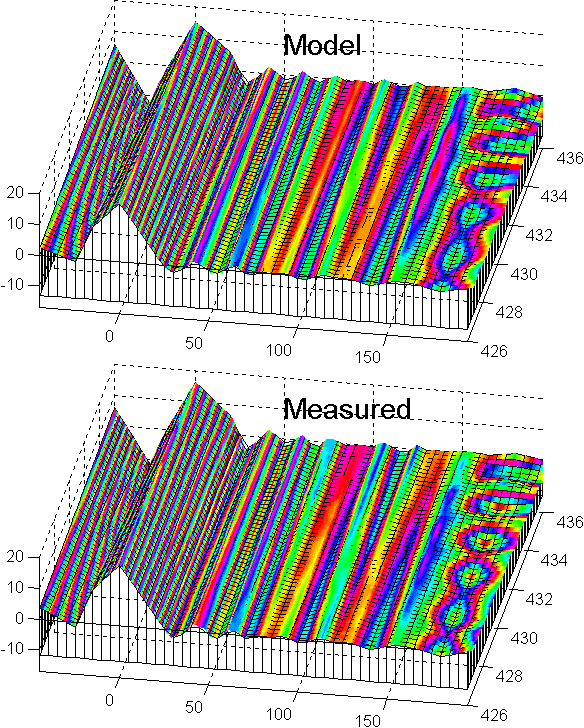

Fig 5. K1FO real part of far field at all frequencies and directions. The vertical scale is Voltage, same units as in fig 1. Horizontal are angle and frequency.
The figure alternates between experiment and model. No particularly interesting difference can be seen.
K1FO imaginary part of far field at all frequencies and directions.
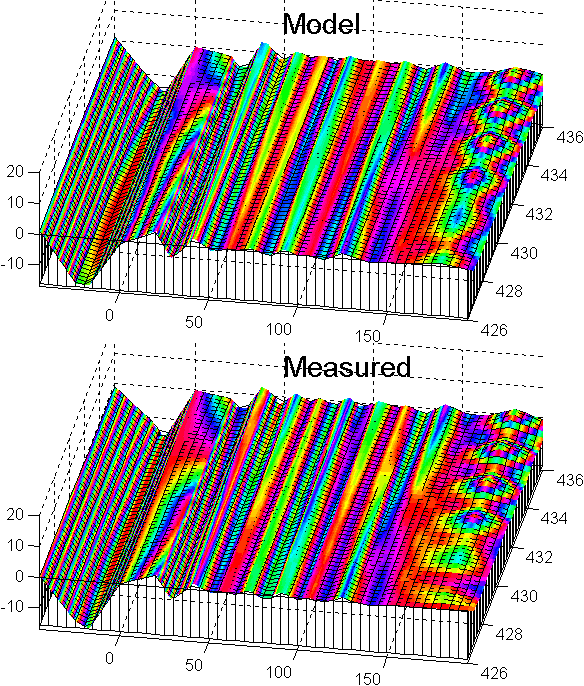

Fig 6. K1FO imaginary part of far field at all frequencies and directions. The vertical scale is Voltage, same units as in fig 1. Horizontal are angle and frequency.
The figure alternates between experiment and model. No particularly interesting difference can be seen.
Cartesian plot of radiation pattern for K1FO.
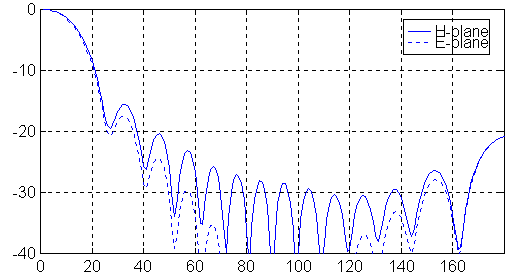
Fig 7. Cartesian plot of radiation pattern for K1FO at 432.0 MHz.
Polar plot of E-plane pattern for K1FO.

Fig 8. Polar plot of E-plane pattern for K1FO.
Polar plot of H-plane pattern for K1FO.
 Fig 9. Polar plot of H-plane pattern for K1FO.
Gain vs frequency for K1FO.
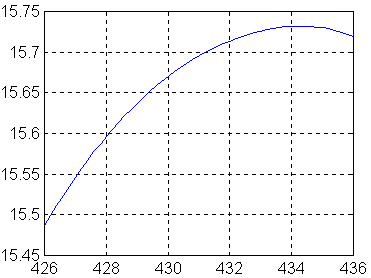
Fig 10. Gain vs frequency for K1FO.
The model fits very well to measured data for all frequencies so the errors in these gain figures are extremely small.