BSZ26 at 432.2 MHz
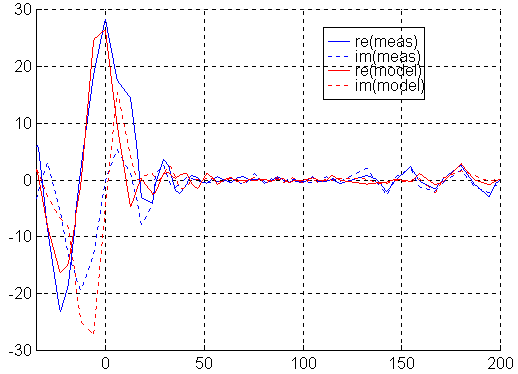
Fig 1. BSZ26 at 432.2 MHz.
The vertical scale is Voltage in arbitrary units. Horizontal is angle in degrees. There is clearly a difference between the model and the measured data. Despite a large penalty, the least squares fitting has moved the data points at 12 degrees to 7 degrees but still the agreement is very poor. The only really similar feature is the low level between 60 and 120 degrees.
BSZ26 at 436.0 MHz.
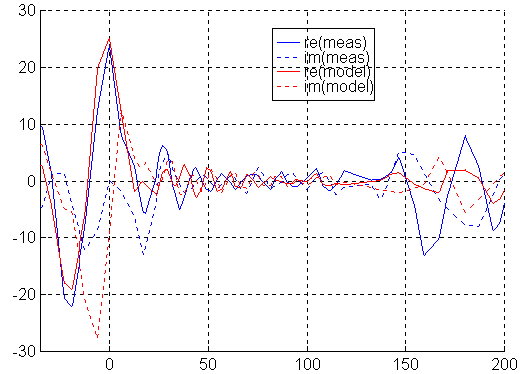
Fig 2. BSZ26 at 436.0 MHz. The vertical scale is Voltage, same units as in fig 1. Horizontal is angle in degrees.
Measurement and model agree that the level between 60 and 120 degrees is much larger than at 432 MHz. Otherwise the agreement is poor.
The back lobe of BSZ26.
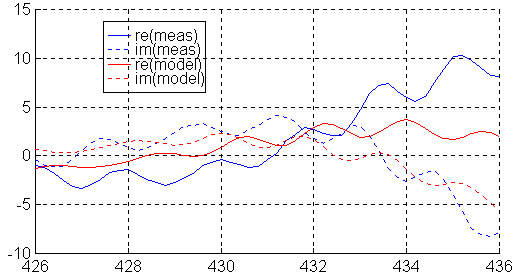
Fig 3. The back lobe of BSZ26.
The vertical scale is Voltage, same units as in fig 1. Horizontal is angle in degrees.
The phase of the reflected wave from behind is incorrect. This is just one more indication that something is really wrong with the model. In an attempt to reduce the dominating errors the parameter fitting process has adjusted the main lobe phase incorrectly. It also made the center of rotation 0.7 meters away from the boom.
Just ignore the model!! But note that this large antenna resolves the two reflections from behind - we can see just a single undulation with constant amplitude.
BSZ26 magnitude of error at all frequencies and directions
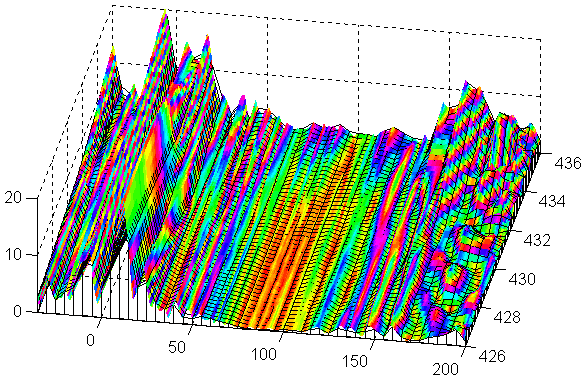

Fig 4. BSZ26 magnitude of error at all frequencies and directions.
The vertical scale is Voltage, same units as in fig 1. Horizontal are angle and frequency.
The model is just not sensible!!!
BSZ26 real part of far field at all frequencies and directions.
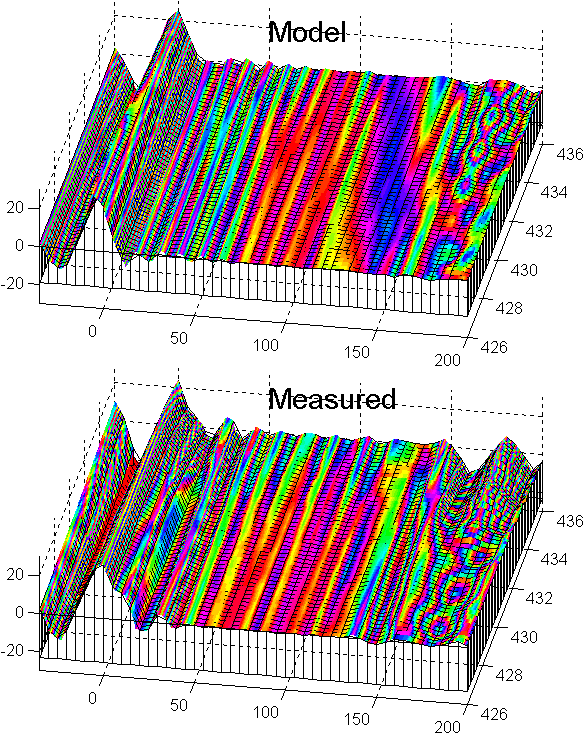

Fig 5. BSZ26 real part of far field at all frequencies and directions.
From figures 5 and 6 we again see that the model is no good!
BSZ26 imaginary part of far field at all frequencies and directions.
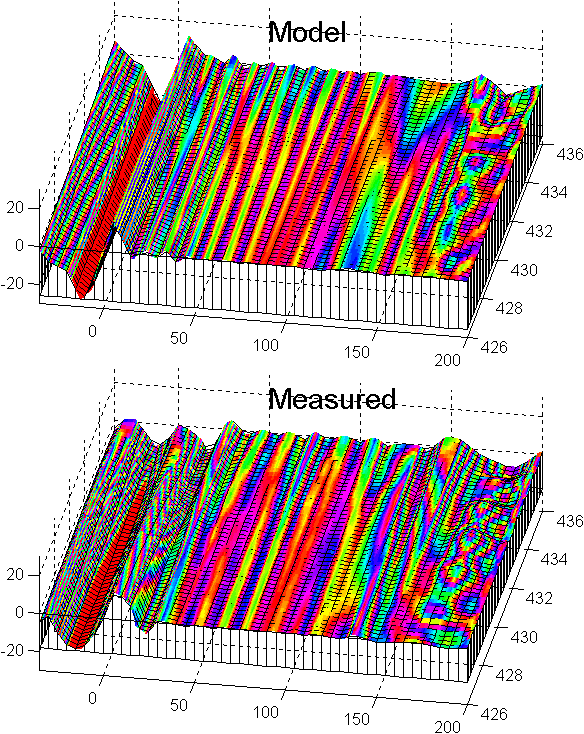

Fig 6. BSZ26 imaginary part of far field at all frequencies and directions. The vertical scale is Voltage, same units as in fig 1. Horizontal are angle and frequency.
From figures 5 and 6 we again see that the model is no good!
Cartesian plot of (incorrect) NEC2 pattern for BSZ26 at 432.0 MHz.

Fig 7. Cartesian plot of (incorrect) NEC2 pattern for BSZ26 at 432.0 MHz.
This pattern is possible according to NEC2. The failure with our attempt to fit the model to our measurements is most probably because NEC2 is just not accurate enough. (But maybe we labeled several data files incorrectly ??)
An antenna with this highly desireable pattern CAN MOST PROBABLY be designed if we only knew how to calculate the matrix elements more accurately.
Gain vs frequency for BSZ26.
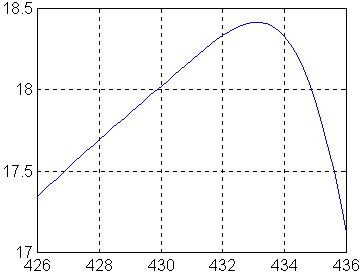
Fig 10. Gain (not experimental) vs frequency for BSZ26.
This is the kind of Gain vs frequency our further experiments aim at. It is for a 10.7 wavelengths long yagi, and the gain is about 1 dB higher than the maximum value usually anticipated for highly optimised yagis of this size.
The real BSZ26 antenna has lower gain, and it can not be reasonably well estimated from our data.