BSZ9 at 144.0 MHz
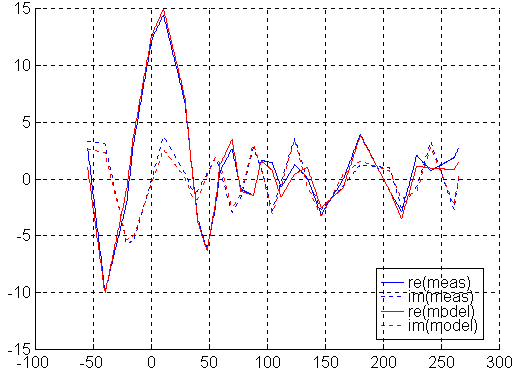
Fig 1. BSZ9 at 144.0 MHz.
The vertical scale is Voltage in arbitrary units. Horizontal is angle in degrees.
The signal is strongest at about 10 degrees elevation. The model closely reproduces the measurement.
BSZ9 at 148.0 MHz.

Fig 2. BSZ9 at 148.0 MHz.
The vertical scale is Voltage, same units as in fig 1. Horizontal is angle in degrees.
At this frequency the side and back lobes are much stronger compared to 144MHz, which measurements and model closely agree upon. 148MHz is well above the maximum operating frequency for this antenna, the side lobes are well above the main lobe.
The back lobe of BSZ9.
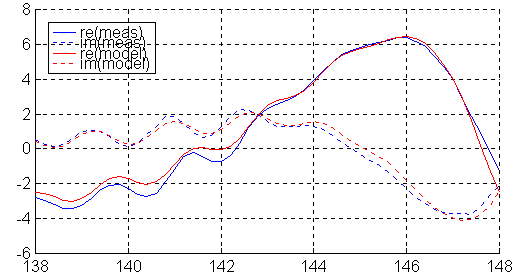
Fig 3. The back lobe of BSZ9.
The vertical scale is Voltage, same units as in fig 1. Horizontal is angle in degrees.
BSZ9 magnitude of error at all frequencies and directions
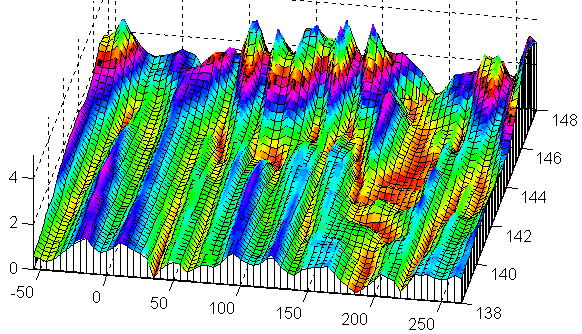

Fig 4. BSZ9 magnitude of error at all frequencies and directions.
The vertical scale is Voltage, same units as in fig 1. Horizontal are angle and frequency.
This graph clearly shows that there is a variation with frequency in the agreement between measurement and model. Even at 148MHz the agreement is good as can be seen from fig.2.
BSZ9 real part of far field at all frequencies and directions.


Fig 5. BSZ9 real part of far field at all frequencies and directions.
The vertical scale is Voltage, same units as in fig 1. Horizontal are angle and frequency.
The figure alternates between experiment and model. The gross characteristics are very similar, but it is clear that the model does not change with frequency correctly. This is an indication that systematic errors within NEC2 can not be fully compensated by a "boom correction" for antennas having very high Q even at this short boom length.
The discrepancies are small, particularly around 144MHz. (Because the parameter fit selected the best over all "boom correction".)
BSZ9 imaginary part of far field at all frequencies and directions.
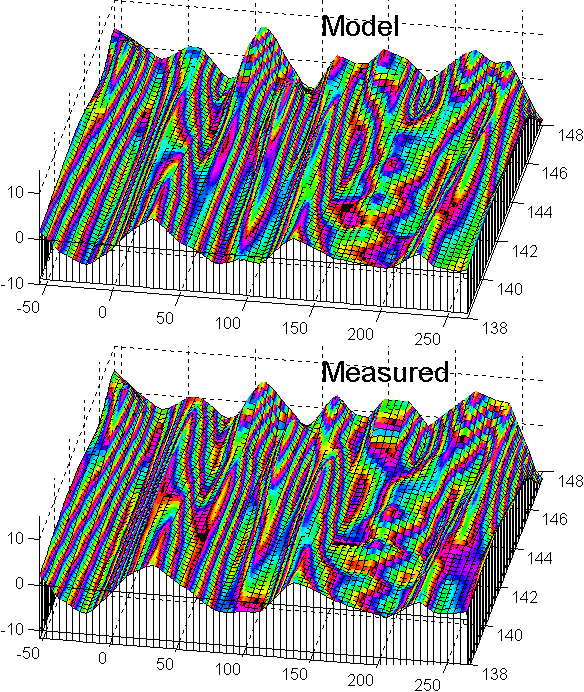

Fig 6. BSZ9 imaginary part of far field at all frequencies and directions.
The vertical scale is Voltage, same units as in fig 1. Horizontal are angle and frequency. The figure alternates between experiment and model. The real part and the imaginary part should be looked on simultaneously but in this case no more useful information can be extracted.
Cartesian plot of radiation pattern for BSZ9.

Fig 7. Cartesian plot of radiation pattern for BSZ9 at 144.0 MHz.
Polar plot of E-plane pattern for BSZ9.

Fig 8. Polar plot of E-plane pattern for BSZ9 at 144 MHz.
Polar plot of H-plane pattern for BSZ9.

Fig 9. Polar plot of H-plane pattern for BSZ9 at 144 MHz.
Gain vs frequency for BSZ9.
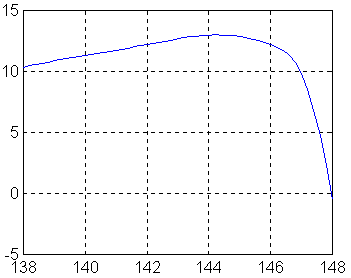
Fig 10. Gain vs frequency for BSZ9.
The model fits well to measured data for all frequencies so the errors in these gain figures are small, particularly around 144MHz.
Note the vertical scale. This antenna is a really narrow band design!!