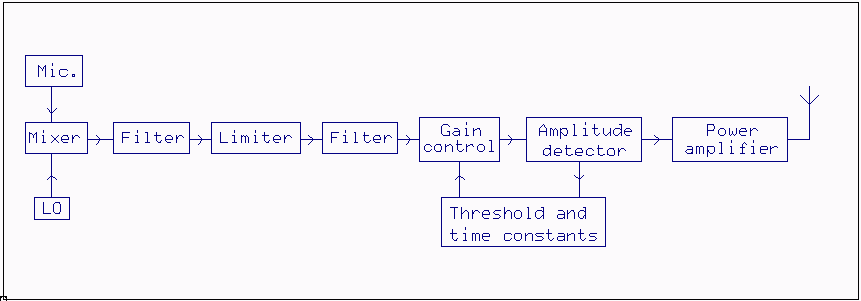
The SSB transmitterThe basic building blocks of a typical SSB transmitter are illustrated in figure 1. The signal from the microphone is mixed with a local oscillator at the desired frequency. A first filter is used to remove the carrier and the LO leakage through the mixer which is typically balanced but not well enough to provide the desired carrier suppression. The filter also removes the undesired sideband and other frequencies produced by the mixed. At the output of the first filter we have an SSB signal that does not produce interference outside the passband. |

|
|
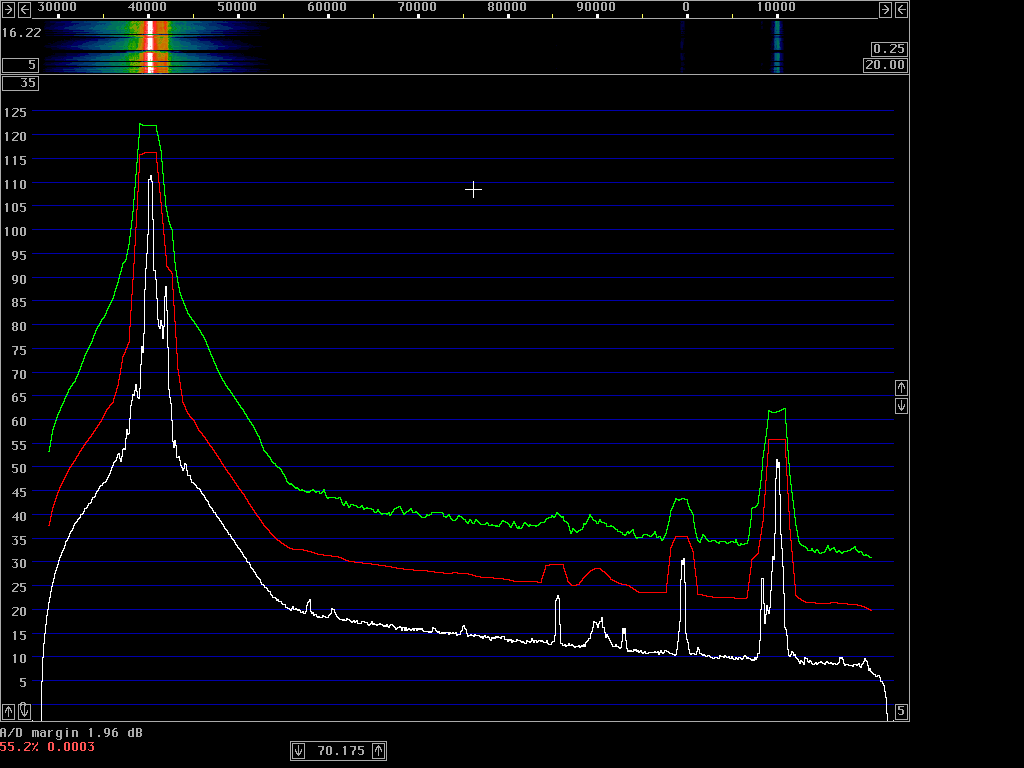
Fig.1. The basic building blocks of a typical SSB transmitter. The power amplifier has a maximum level that should not be exceeded. The voice signal from the microphone has a large dynamic range and if the operator just is careful, speaking as loud as possible while monitoring some indicator, say keeping the control grid current of a power zero, the average output power at the maximum voice level will be in the order of 1% of the peak power only. To produce more average power a circuitry is added that limits the peak power. This allows the average power to reach about 10% of the peak power. Limiting the peak voltage, clipping at some maximum level will make the signal spectrum broader, but since the first filter already made the signal have the desired bandwidth, the clipping will make the signal extend into neighbouring channels. Therefore a second filter is added to clean up the signal and restore the desired bandwidth. After having reduced the dynamic range of the signal, a servo system, the automatic level control, ALC is used to set the gain properly so the power amplifier is used all the way up to its maximum capacity, but not above. Other solutionsThe SSB signal can be produced without a filter by use of the phasing method and the dynamic range of the voice signal can be limited at audio frequencies. It is possible to produce a perfect SSB signal without any filter, limiter or ALC system but that is not what we find in commercial amateur transmitters.What we do find however is that amateur radio transmitters use the ALC to reduce the dynamic range of the SSB signal, in other words, it is used to increase the ratio of transmitted average power to peak envelope power (using a formulation from the ARRL handbook). With short time constants the ALC then becomes an RF syllabic compressor and with even shorter time constants it becomes an amplitude limiter. Mis-using the ALCThe block "gain control" in figure 1 is technically an AM modulator. The SSB signal is amplitude modulated with the ALC control signal and in the process sidebands are added to the SSB signal. How far these sidebands reach into surrounding channels depends on the bandwidth of the ALC control signal.All amateur transceivers I have tested use the ALC as a speech compressor and it is very common that they produce severe interference in surrounding channels because of that. This is the reason for the provocative title of this article. The title "The abominable ALC." should really be understood as: The abominable mis-use of ALC as a speech processor". The ALC circuitry will typically have a fast attack, slow release characteristic. When it is used for speech compression, the control voltage will be a sawtooth-like waveform that contains very high frequencies. As a result, the splatter will then extend over typically 50 kHz. A two-tone test will not show much of this because while the voice is like pulses with a repetition frequency in the order of 100 Hz, the signal in a two-tone test is like pulses separated by the difference frequency of the two tones, typically 1 kHz. When charged 10 times more often, the capacitor of the slow release time constant will get a sawtooth waveform with 10 times lower amplitude so the generated AM modulation will be 20 dB lower. While using ALC for some speech processing might have been justified in the vacuum tube era because it allows solutions with very few components, it is not an acceptable way of doing speech processing in modern equipment. The big problem is that the ALC is often used to compress too much with too much bandwidth. When ALC speech processing is carefully done the problems are not severe, but my experience from testing many modern transceivers is that ALC circuits are not carefully done and that they are very often mis-used to produce severe interference to fellow radio amateurs. There are several ways of doing good speech processing without using the ALC for that purpose. The ALC should be seen as a saftey precaution that sets the gain at the optimum level, but that does only change very slowly with time. In a modern transceiver with a microprocessor, the natural solution is to use the microprocessor to control the transmitter gain in a way that limits the bandwidth of the ALC signal to below 1 kHz or less. Real signals from a FT-1000DThe spectrum emitted from a FT-1000D which is operated according to the operating manual with the speech processor enabled is shown in figure 2 which is a screen dump from Linrad in "Tx test mode". The green curve is peak power in 2.4 kHz bandwidth while the red curve is average power in 2.4 kHz. The white curve is average power in 20 Hz bandwidth although the number of pixels does not allow this resolution on screen. |
|
|
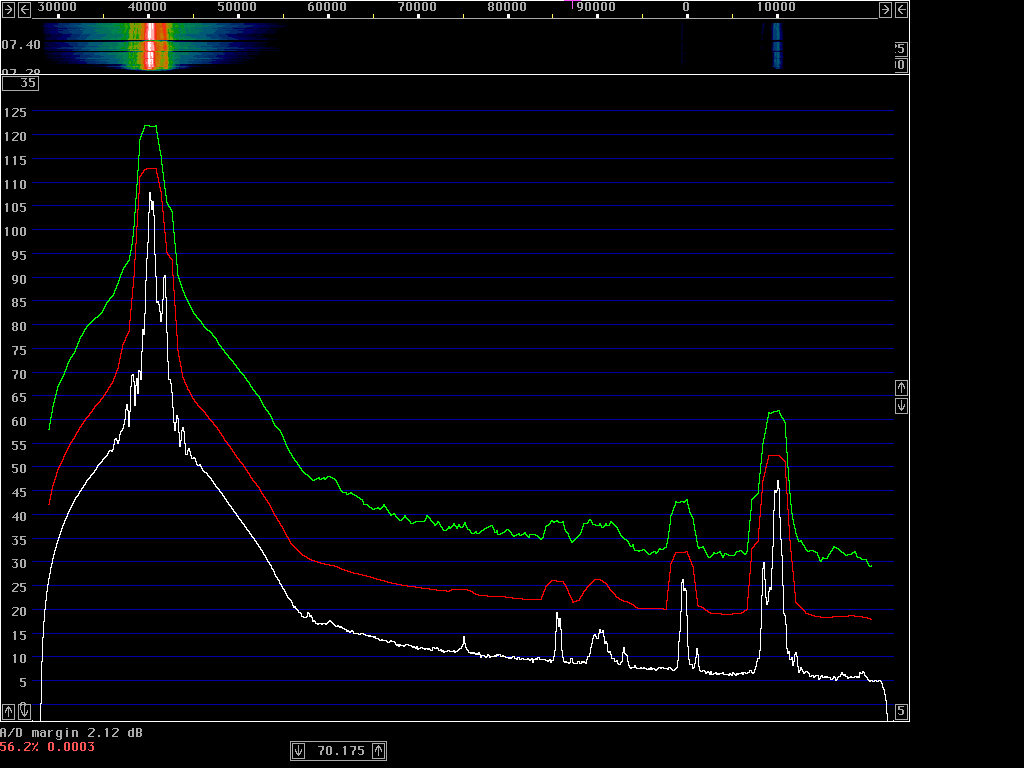
Fig.2. FT1000D operated as recommended by the manufacturer with "aaaaaaaaaaaaaaa" into the microphone and the speech processor enabled. The FT1000 is good compared to most amateur transceivers, still it creates a lot of splatter for no good reason. Figure 3 shows what the spectrum looks like when the speech processor is switched off, still running the transmitter as described in the operating manual. |
|
|
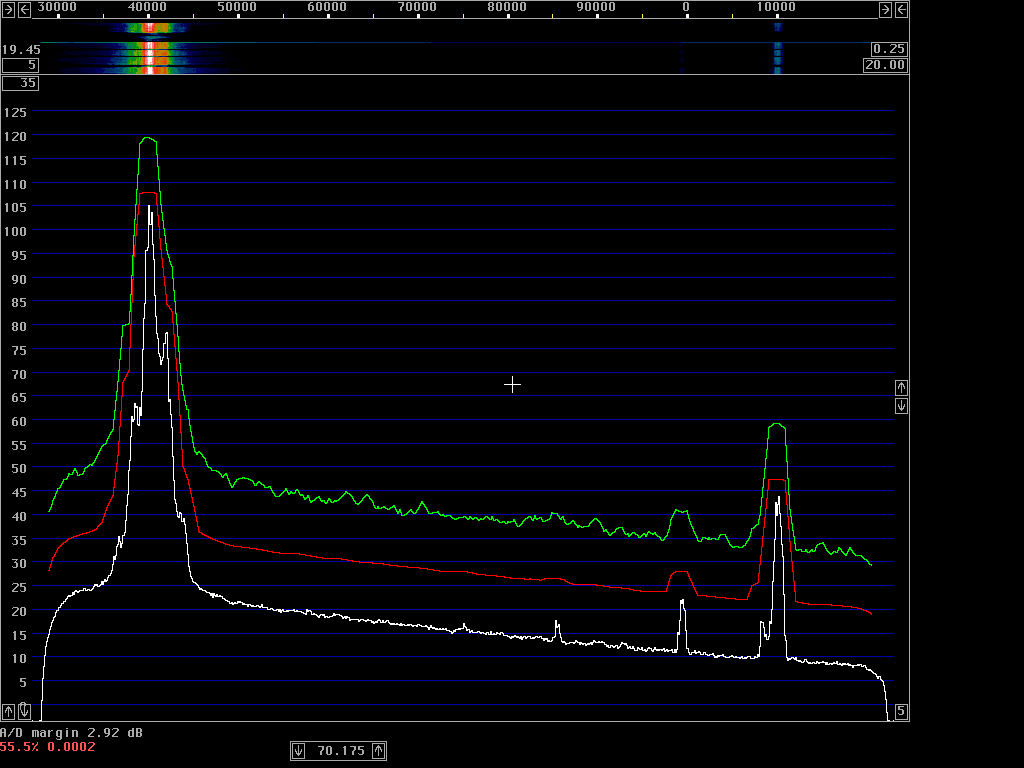
Fig.3. FT1000D operated as recommended by the manufacturer with "aaaaaaaaaaaaaaa" into the microphone and the speech processor disabled. When the speech processor is switched off, the average to peak power ratio drops from -5.7 to -9.0 dB. The peak power drops by 0.16 dB only, but the splatter level 10 kHz away increases by 7.4 dB. A better way of operating the FT1000D is to turn down the drive level until the ALC becomes inactive. If this is done without the speech processor, the average power output will become low but the spectrum becomes clean and the sound quality excellent. Figure 4 shows what the spectrum looks like without any speech processing at all. |
|
|
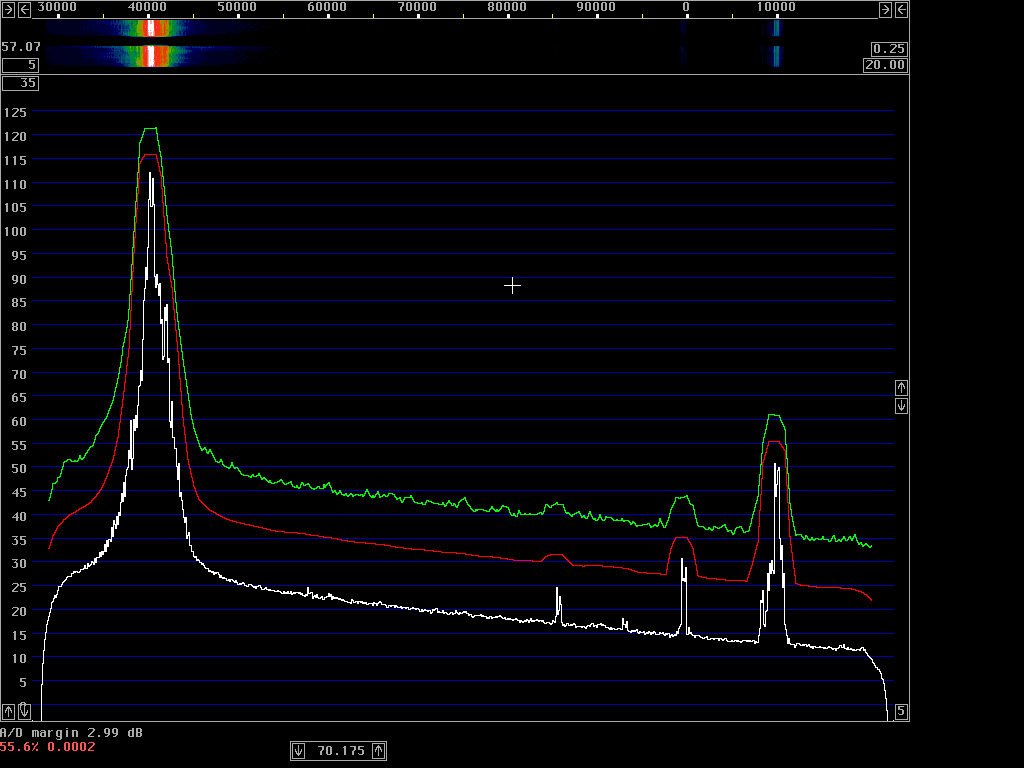
Fig.4. FT1000D operated with low microphone gain that makes the ALC inactive with "aaaaaaaaaaaaaaa" into the microphone and the speech processor disabled. When the FT-1000D is operated in linear mode, the splatter 10 kHz away disappears completely. The peak power of the noise floor does not go below -72 dB in 2.4 kHz bandwidth because of the sideband noise which is present also when a pure carrier is emitted in CW mode. In linear mode, the average power is 11.5 dB below the peak power. It is practically impossible to keep the voice just below the point where the ALC starts acting so figure 4 is not intended to show anything but principles. Figure 5 however shows the FT1000D operated the way I think it should be operated. The speech processor is enabled but the drive level is set just below the point where the ALC becomes active. |
|
|
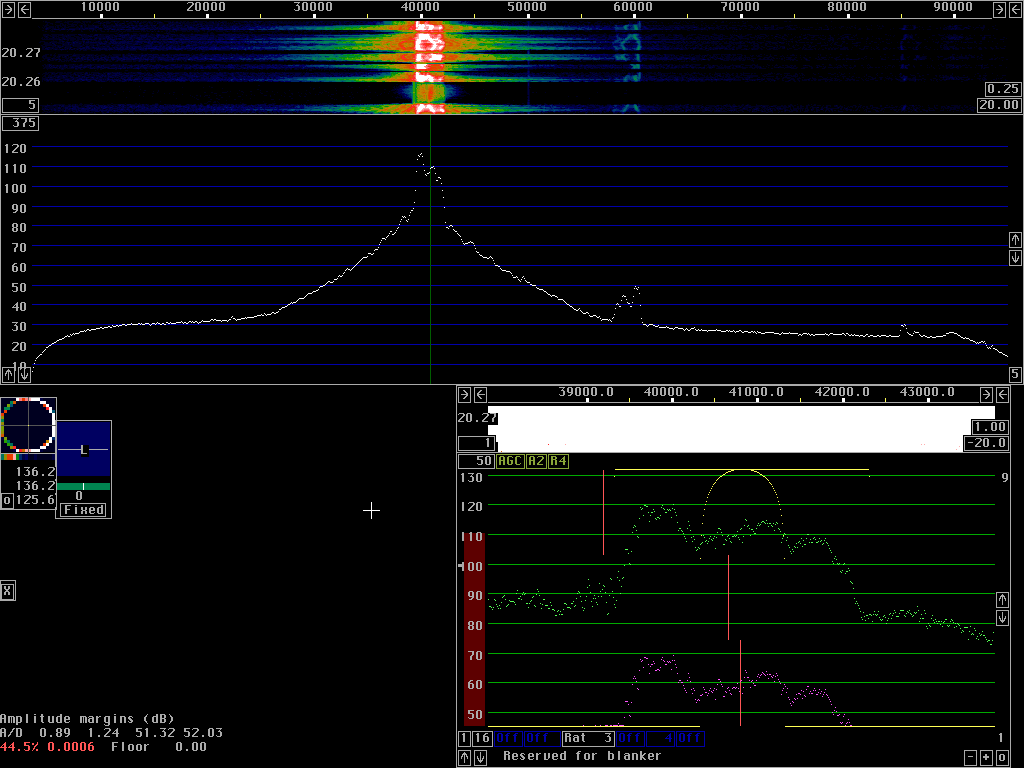
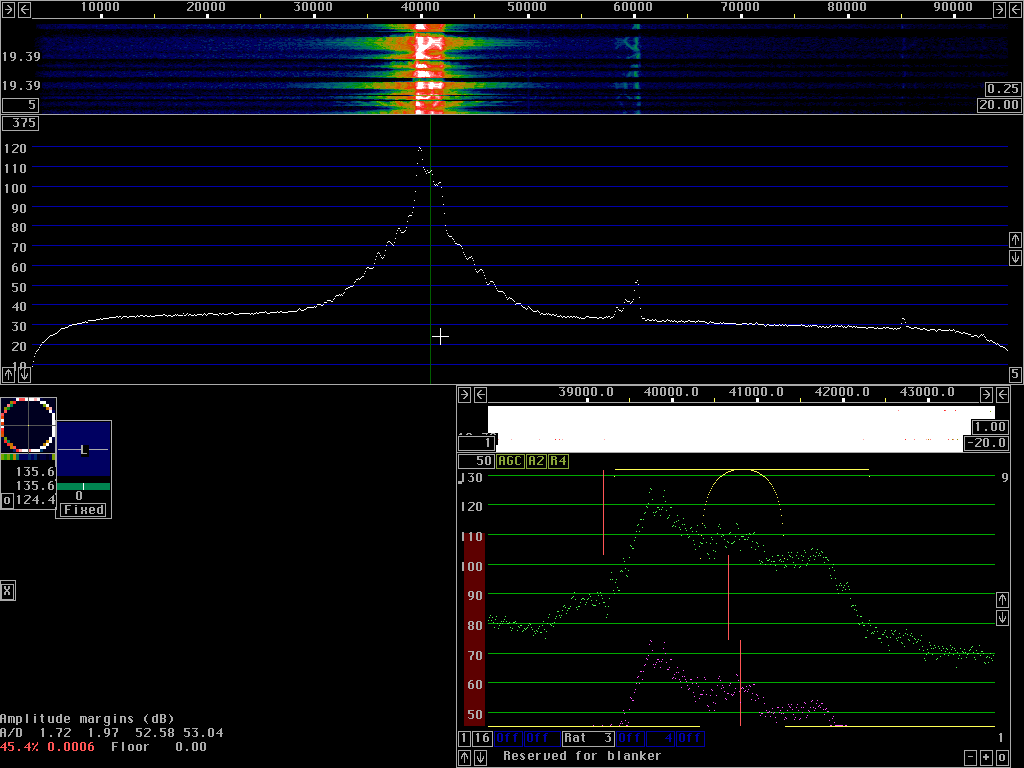
Fig.5. FT1000D operated with the RF speech processor to set the desired degree of compression, the same as in figure 2. The drive level is set for the ALC to become inactive. When operated with the processor but without the ALC, the FT-1000D emits a very clean signal. The peak output power is about 1 dB lower compared to the power when operated according to the operating manual but the average to peak power ratio is the same. When operated like this, the FT-1000D does not produce any splatter at all, the emissions in neighbouring channels are due to sideband noise of various origins. Real on the air performance of the FT1000DThe images above, figures 2 to 5, all show spectra with "aaaaaaaaaaaaaaa" into the microphone. By running Linrad in normal mode, recording the entire 96 kHz bandwidth on the hard disk, one can listen to one's own transmitter as if the signal arrived from the antenna. Figure 6 shows the spectrum when FT-1000D is operated according to the operating manual while figure 7 shows the spectrum with a little more speech processor compression and a little less drive level for the same average output power but without ALC reducing transmit power. |
|
|
Fig.6. A normal voice transmission with the FT1000D operated as recommended in the operating manual. |
|
|
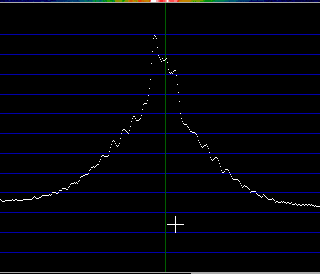
Fig.7. A normal voice transmission with the FT1000D operated with slightly reduced drive level to avoid ALC action and with slightly more RF processor compression to get the same average output power. When listening to the two recordings used to produce figures 6 and 7, it is not possible to hear any difference. The signal has an excellent quality in both cases. When listening in the surrounding channels, the splatter really sounds much worse when the ALC is active. Figure 8 shows the center parts of fig. 6 and 7 to make a comparison of the average powers easier. |

|
|
|
Fig.8. The central parts of figures 6 and 7 side by side. Not using the ALC reduces the bandwidth of the splatter by a factor of two but it increases the sideband noise at larger frequency separations. Not using the ALC reduces the bandwidth of the splatter by about a factor of two but it increases the sideband noise at larger frequency separations. This is consistent with the sideband noise tests for a pure carrier. Other transceiversThe spectra above use the FT-1000D to illustrate principles. When operated as recommended in the operating manual, the signal is already very good compared to other transceivers.
--------------------------------------------------------------
Model          Splatter below PEP
              @5kHz    @10kHz   @15kHz
              (dB)      (dB)     (dB)
FT-897         -28      -36       -40
FT-1000D       -46      -67       -79
IC-706MKIIG    -28      -38       -47
TS-450S        -38      -59       -68
TS-2000        -32      -50       -64

Table 1. Splatter peak level in 2.4 kHz bandwidth
in dB below the peak power in nearby channels.
For details:performance data of modern transceivers.
------------------------------------------------------------
It is clear from table 1 that the FT-1000D is much better than any
other transceiver I have tested.
Yet the images above show that it can easily be dramatically improved.
If the wideband sideband noise were reduced from -118 dBc/Hz at
20 kHz (ALC inactive) to -135 dBc/Hz, a value that one should
expect from a good modern transceiver, avoiding ALC as discussed above
becomes much more important.
With an ALC that modulates the SSB signal with splatter, a good
signal without sideband noise is no advantage, the splatter will
be the limiting factor for the quality of the transmitted signal.
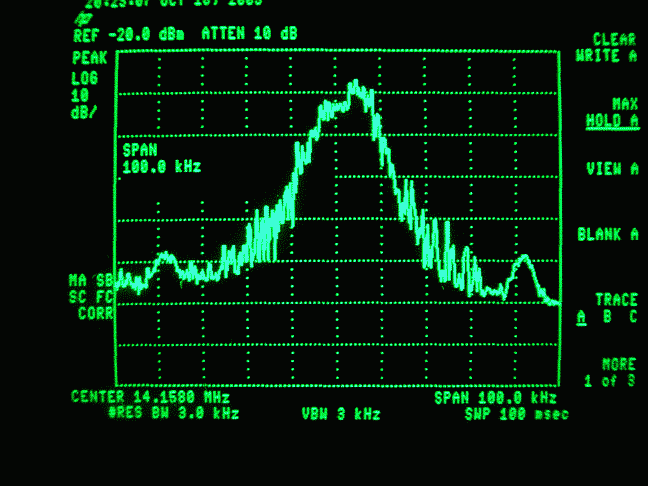
What you can read on this page is not new at all. Already in 1981 I had problems with interference from a neighbour who used a FT-225RD. It used the ALC for audio compression with wideband splatter as a result. A very simple modification allows the FT-225RD to use the speech compressor intended for FM for SSB also. This removes the splatter completely since then the ALC does not become active at all. For details, look here: Modify the FT-225RD Linrad-01.21 and later versions have a time domain oscilloscope that shows the envelope of the RF signal. It is quite obvious from the shape of the RF envelope that the ALC voltage is oscillating and causing strong AM modulation. This is an example of a phenomenon that is common in modern transceivers and that should not be accepted by the amateur radio community. Look here for details: Oscillations in the ALC voltage of the IC706MKIIG Market economy and product testing.Receiver performance has improved over the years. The reason is of course that the companies who earn money from selling amateur transceivers compete on the market and those who can offer a better performance at a lower cost will make better bussines. This is all very good and we can see that the properties for which performance data is made available in the major amateur journals have improved.On the receive side a typical transceiver provides a dynamic range of 125 dBHz, good ones are probably at 135 dBHz or better. It would be meaningful to make the transmitters provide a similar quality, 135 dBHz corresponds to a peak power in 2.4 kHz of -90 dB. The unbalance between receiver and transmitter performance is often in the order of 30 dB. The reason is not the intermodulation in the power amplifier, the transmitter property that is made public in product rewievs. The reason is badly designed power control (ALC) or other trivial design errors that would not increase the production cost at all if they were corrected. There are many good ways to make transmitters that produce a good signal that has very little splatter. The test of the FT-1000D above indicates that the splatter level would be at -95 dB in 2.4 kHz if there was no sideband noise. This means that the linearity of the FT-1000D is good enough with a margin of 5 dB to be compatible to a good modern receiver with a dynamic range of 135 dBHz and a carrier sideband noise level of -135 dBc/Hz. The transmitter two-tone test results for the FT-1000D are very similar to the results for any other modern transceiver. The dominating mechanism is not the non-linearity of the amplifiers, the real problem is often the ALC, but it can be inadequate power supplies and many other things. With the above in mind, and supported by the really discouraging results from measuring transmitter spectra with the owner himself as the operator, running the transmitter the way he is used to on the air, I want to make all amateurs worldwide to talk to their friends who are involved in product testing to about the following things: 1) Modern transmitters often emit a lot of interference on surrounding channels when operated normally on the air. 2) The interference typically behaves differently in different transmitters, the mechanism behind is very complex. 3) Product testing does not mean that one wants a test for which there is a pass or fail. The testing should be performed in a way that reveals the weak points of a transmitter and allows the amateur to make a judgement whether any deficiences may be important to him. 4) The standardized two-tone test is completely meaningless on a transceiver. It is a good test for design engineers but should not be used for product testing. 5) The way to test a transmitter is to try it with the test engineer speaking into the microphone while looking at the spectrum trying to make it as wide as possible. For a good transmitter the bandwidth will remain narrow regardless of what is being sent into the microphone. 6) Besides looking at the spectrum with a spectrum analyzer in peak hold mode while speaking and shouting into the microphone (DX exalted voice) as well as soft voice and with pauses and click sounds, the test engineer should investigate what happens when the PTT button is pressed and released. He should also make sure that the worst case spectrum is recorded within normal ranges of the transmitter controls. The FT-1000D with reduced drive level is an example of a design that gives a splatter-free signal. It is just impossible to produce any off channel interference by doing things to the microphone once the knobs are set right. That is the way all transceivers should behave, but very far from what they actually do. Have a look at these examples. These are signals generated by amateur transceivers in their original shape, the reason for the really bad transmitter performance in these cases is most probably in the ALC. These transceivers are in untampered original shape, something is wrong with them, but with a reasonable design of the ALC system, a terrible splatter level like the one observed would not be possible unless the poweramplifiers were overloaded (which is not the case in these examples). IC706MKIIG in CW mode IC706MKIIG in SSB mode FT817 in SSB mode TM255E in SSB mode (average power only) FT100 in SSB mode (average power only) I am confident that equipment manufacturers will have no problem at all to limit the transmit signal level at the correct side of the SSB filter and that they can control the signal into the power amplifier without introducing noise or wideband modulation. Once it is made public how different transceivers behave, chances are good that the next generation transceivers will be much better - and that will give the manufacturers a good argument why we should buy a new rig to replace the old one. In the long run there will only be winners. Practical aspects of transmitter measurementsThe measurement is straightforward and simple. A standard spectrum analyzer has a dynamic range of about 80 dBHz. To be able to check really good transmitters one would need a dynamic range of 140 dBHz. A notch filter that attenuates by 60 dB over 2 kHz but that has a flat response with low losses a few kHz away from the notch will convert a standard spectrum analyzer to one that has the desired dynamic range for the sidebands surrounding a signal that is transmitted on the notch frequency.Figure 9 shows the FT-1000D operated according to the operating manual, just as in figure 2. The frequency is set to 14.158 MHz and a notch filter is inserted in the signal path. |

|
|
Fig.9. The FT-1000D is operated as in figure 2. A notch filter is used to remove most of the main signal. The same signal that is displayed in figure 9 is well visible on a HP8591A spectrum analyzer. Figure 10 is a photo of the HP8591A screen. |
|
|
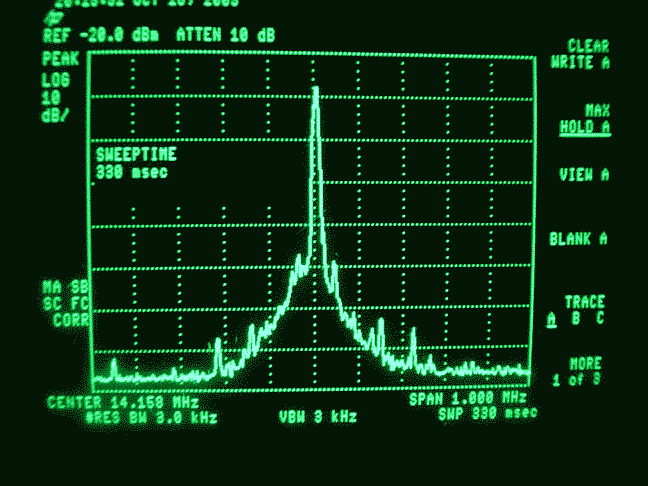
Fig.10. The same as fig 9 but as seen on a HP8591A. The peak power is 24 dB above the top of figure 9 which means that the peak level of the noise floor 35 kHz above the signal is 58 + 24 = 82 dB below the peak power in 3 kHz bandwidth. On the Linrad screen the level is 41 dB and the peak level which we can read from figure 2 is 122 dB. The HP8591A thus indicates that the noise floor is 81 dB below the peak power. The nominal bandwidth of the HP analyzer is 3 kHz, but that is the 3 dB bandwidth The HP analyzer also has a video filter with a bandwidth of 3 kHz that causes a little averaging. The comparison to Linrad indicates that the effective noise bandwidth of the HP8591A is 1.9 kHz. The HP analyzer allows a wider bandwidth to be monitored on screen. Figure 11 shows the FT-1000D with a screen bandwidth of 1 MHz. |
|
|
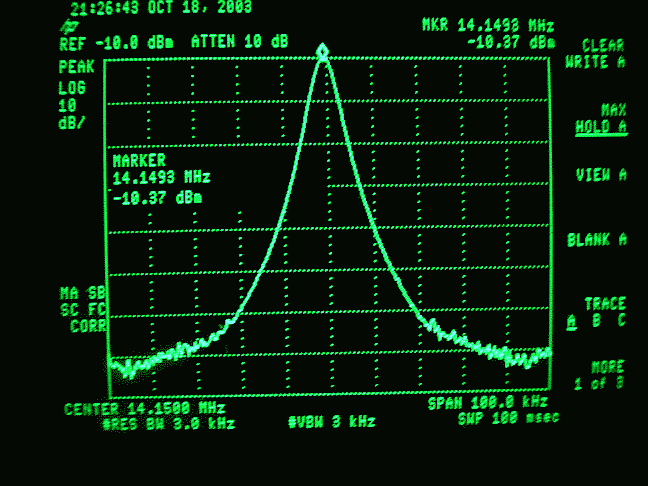
Fig.11. The same as fig 10 but with a screen bandwidth of 1 MHz. It is clear from figure 11 that the sideband noise of the FT1000D decreases rapidly as the frequency separation is increased above 50 kHz. The spurs are very low. From the figures above, the notch filter may seem superfluous. That is not the case however. Figure 12 shows a CW carrier recorded with a 25 dB attenuator replacing the notch filter. The HP spectrum analyzers use Gaussian filters because that optimizes the sweep time but that is not good at all for sideband noise studies. A filter with 3 kHz bandwidth at the 3 dB points is 40 kHz wide at the -60 dB points. It is impossible to see sideband noise or splatter unless the test object is really bad. Shift the curve of figure 12 upwards by 24 dB and compare to figure 10. At half scale the splatter in fig 10 is 30 kHz wide, but the 24 dB up-shifted figure 12 is over 40 kHz wide. The splatter is invisible. |
|
|
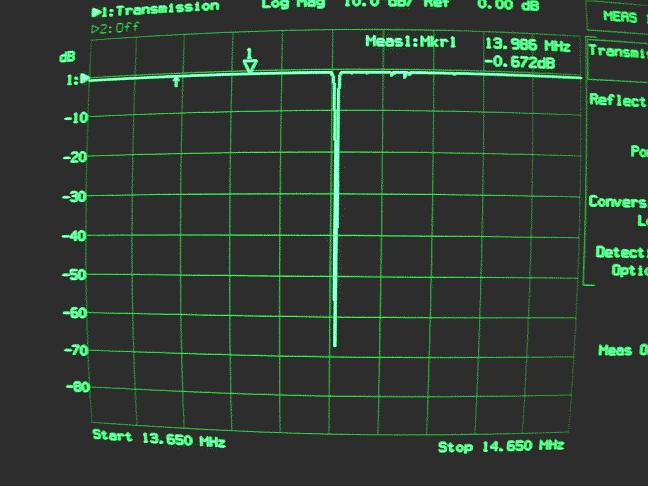
Fig.12. A carrier as seen by the HP8591A. Compared to figure 10 the notch filter is replaced by a 25 dB attenuator and the FT-1000D is run with a steady carrier. The power is the same as the peak power in fig 10. It is trivial to design notch filters. The one used for the tests in this article has the frequency response shown in figures 13 and 14. |

|
|
Fig.13. The notch filter response with 5 kHz per division. |
|
|
Fig.14. The notch filter response with 100 kHz per division. Another way to measure tx perormance is of course to use a Linrad system with the WSE converters. To SM 5 BSZ Main Page |