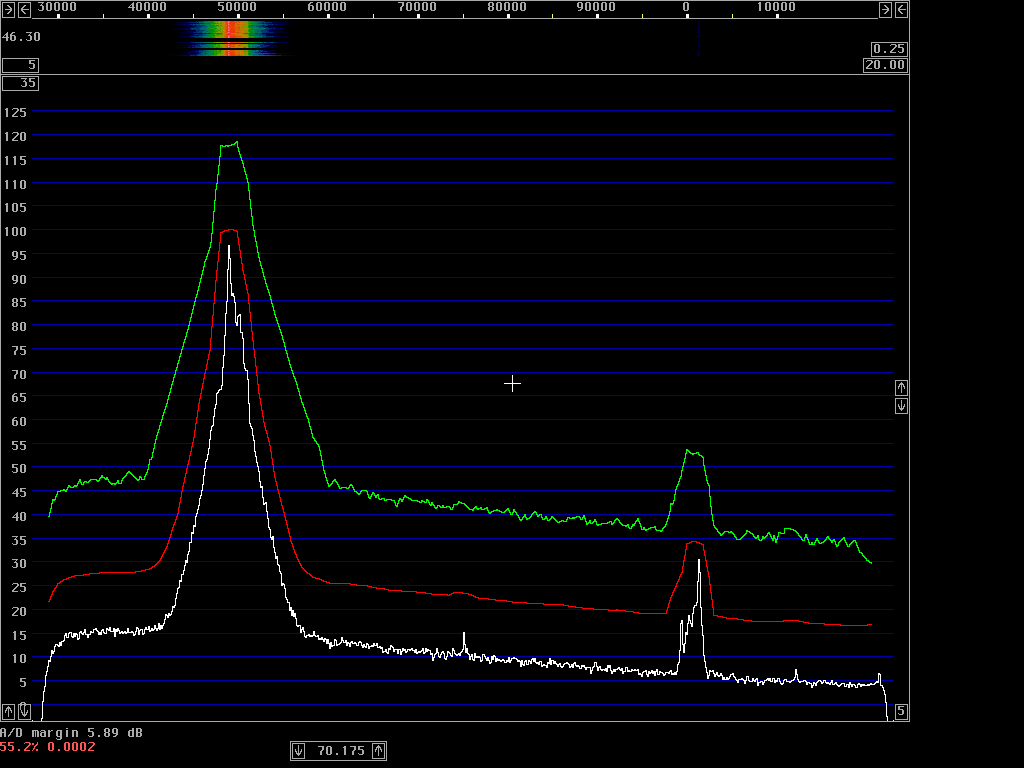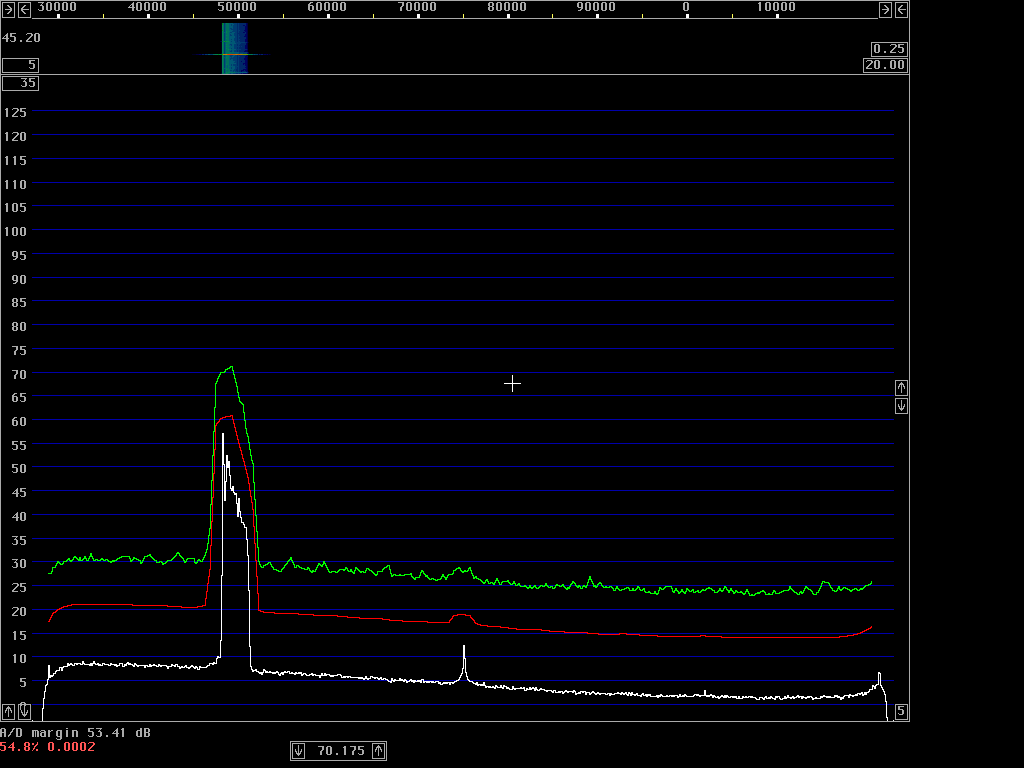
Fig. 1 Transmitter off.
Setup to measure transmitter spectral purityThese measurements were made with Linrad running on a PentiumIII 600MHz computer with a modified Delta44 soundcard. The 144 MHz signals were converted to audio by use of the WSE converters RX144, RX70, RX10700 and RX2500.Linrad was run in Tx test mode Figure 1 shows the screen when the FT-1000D is not transmitting.
|

The measurement system has much better dynamic range than required for these measurements so no corrections have to be made for the noise contribution from the measurement system.

The numbers in table 1 below are extracted from the red curve of figure 2 which is average power in 2.4 kHz bandwidth (100 dB is 475 pixels).
------------------------------------------------------
   Freq       Coordinates          Level    Sideband
separation     X        Y         2.4 kHz    noise
   (kHz)    (pixels) (pixels)      (dB)     (dBc/Hz)
     0        230      131          0.0        -
     5        275      482        -73.9      -107.9
    10        320      513        -80.4      -114.4
    15        365      526        -83.2      -117.2
    20        410      533        -84.6      -118.6
    50        559      559        -90.1      -124.1
------------------------------------------------------
Table 1 Spectrum of FT-1000D emitting continuous carrier.
The drive level is set just below the ALC threshold and the output
power is 177 W (3.54 dB below 400 W)The noise floor does not originate in the local oscillator only. By turning up the drive level and thereby allowing the ALC system to reduce the transmitter gain after the SSB filter it is possible to reduce the sideband noise. Figure 3 shows a screen dump with more drive level. The drive level is turned up until the sideband noise does not improve any more.
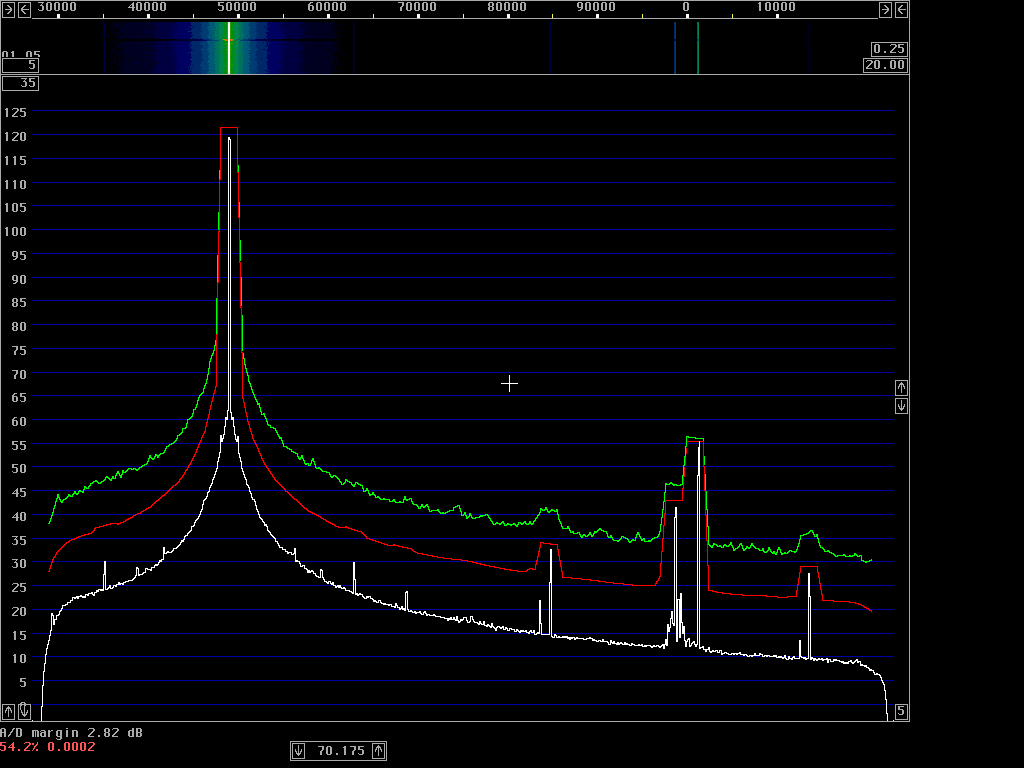
The numbers in table 2 are extracted from the red curve of figure 3 which is average power in 2.4 kHz bandwidth (100 dB is 475 pixels).
------------------------------------------------------
   Freq       Coordinates          Level    Sideband
separation     X        Y         2.4 kHz    noise
   (kHz)    (pixels) (pixels)      (dB)     (dBc/Hz)
     0        230      128          0.0        -
     5        275      480        -74.1      -108.1
    10        320      518        -82.1      -116.1
    15        365      538        -86.3      -120.3
    20        410      574        -93.9      -127.9
    50        559      586        -96.4      -130.4
------------------------------------------------------
Table 2 Spectrum of FT-1000D emitting continuous carrier.
The drive level is set for the ALC to be just above
center scale.
The output power is 209 W (2.82 dB below 400 W)
Do not turn the drive level too high, if the ALC meter goes above the safe area, the ALC will cause keying clicks.
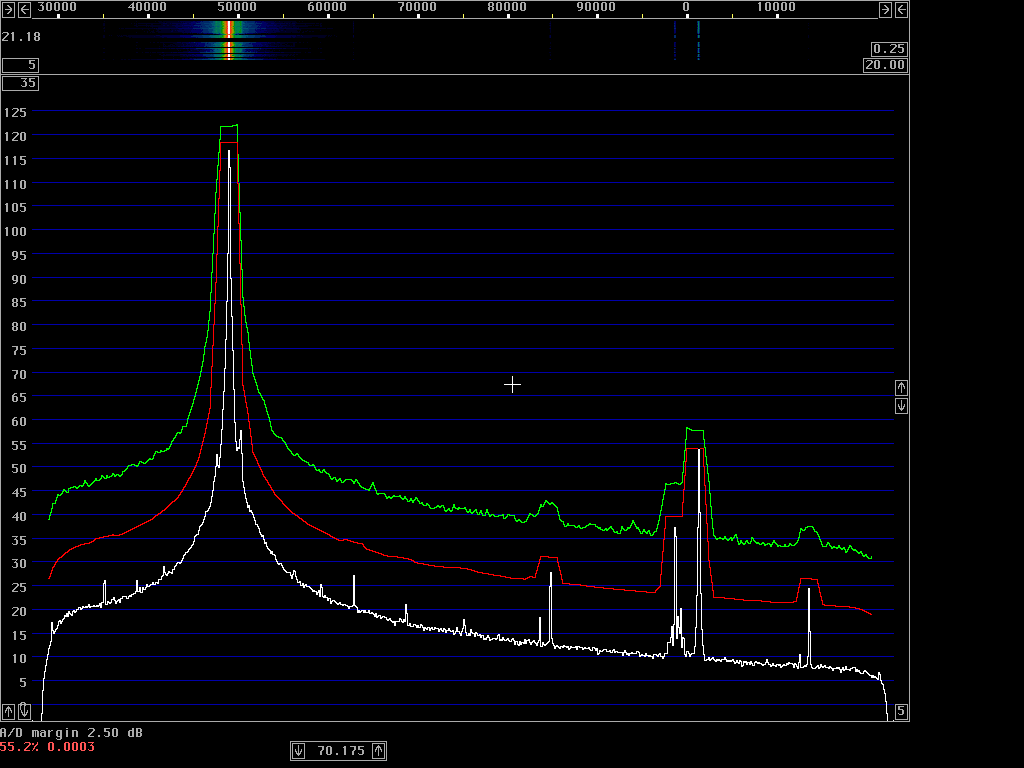
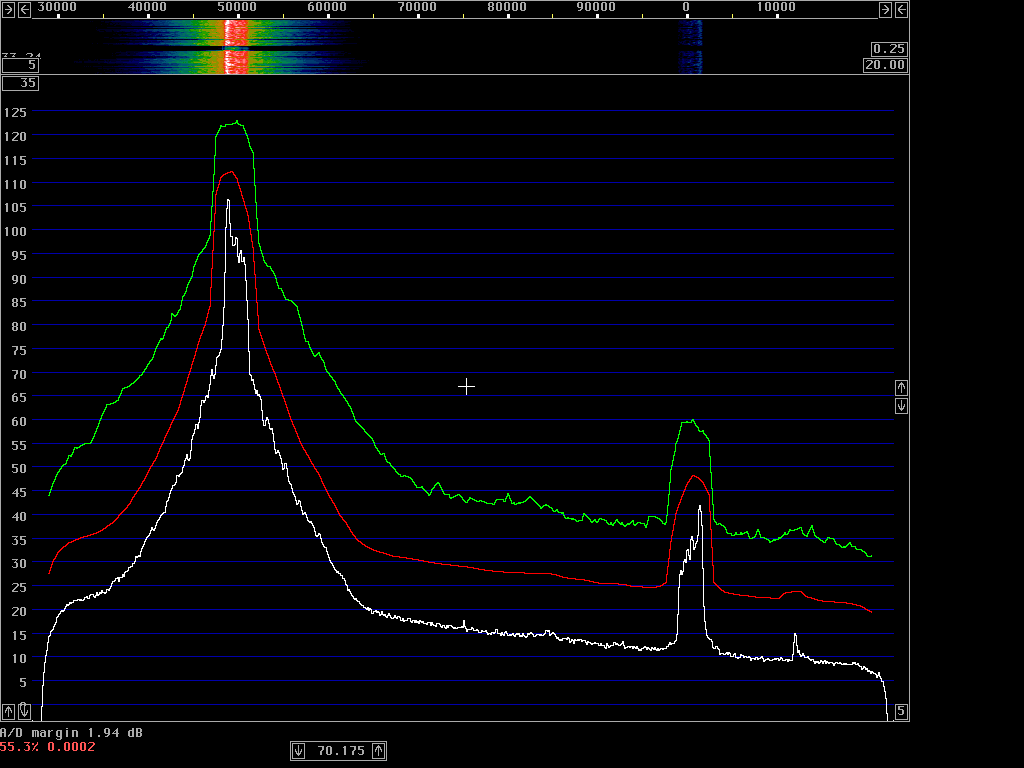
The numbers of tables 3 and 4 are extracted from the SSB spectrum of figure 5.
   Freq       Coordinates       Level   Sideband   Increase
separation     X        Y      2.4 kHz   noise     vs carrier
   (kHz)    (pixels) (pixels)   (dB)    (dBc/Hz)     (dB)
     0        236      173       0.0       -
     5        281      392      -46.1     -80.1       28
    10        326      490      -66.7     -100.7      15
    15        371      550      -79.4     -113.4       7
Table 3.Average powers from red curve.
   Freq       Coordinates       Level
separation     X        Y      2.4 kHz
   (kHz)    (pixels) (pixels)   (dB)
     0        236      124       0.0
     5        281      290      -34.9
    10        326      369      -51.6
    15        371      437      -65.9
Table 4.Peak powers from green curve
The data of tables 3 and 4 is obtained with the transmitter adjusted according to the instruction manual for a compression of 5 to 10 dB and with the ALC meter at half scale on voice peaks, but not above the end of the blue ALC scale. The peak power is 261 W (1.94 dB below 400W)
Operation as recomended in the operating manual is not optimum however. The ALC is used to limit the power output and since the bandwidth of the ALC loop is large this means that the ALC is an AM modulator that adds wideband AM modulation to the signal. One can reduce the drive level until the ALC does not act at all, then one may compensate for the reduced clipping by setting the speech processor slightly higher. The peak power will then be a little lower, 210 W (2.8 dB below 400W). Figure 6 shows what the spectrum looks like.
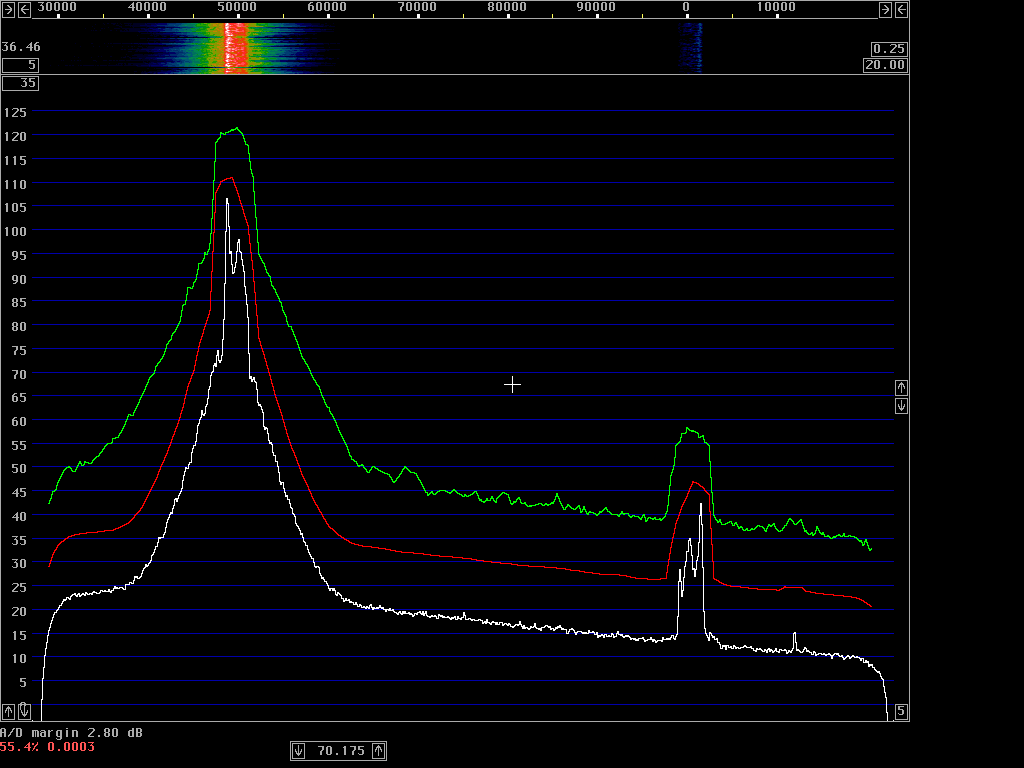
The numbers in tables 5 and 6 are extracted from figure 6.
   Freq       Coordinates       Level   Sideband   Improvement
separation     X        Y      2.4 kHz   noise    vs recommended
   (kHz)    (pixels) (pixels)   (dB)    (dBc/Hz)      (dB)
     0        236      179       0.0       -
     5        281      414      -49.5     -83.5        3.4
    10        326      524      -72.6     -106.6       5.9
    15        371      547      -77.5     -111.5      -1.9
Table 5. Average powers from red curve
   Freq       Coordinates       Level     Improvement
separation     X        Y      2.4 kHz  vs recommended
   (kHz)    (pixels) (pixels)   (dB)        (dB)
     0        236      129       0.0
     5        281      304      -36.8        1.9
    10        326      404      -57.9        6.3
    15        371      470      -71.8        5.9
Table 6. Peak powers from green curve
The slightly reduced drive power causes the output peak power to drop by 0.86 dB while the splatter is reduced by about 6dB at a frequency separation of 10 kHz. At 15 kHz separation, the average noise floor is degraded by the lower drive level. Having the ALC inactive increases the noise floor as was shown for the steady carriers above.
For some more screen dumps of this FT-1000D in SSB mode and a discussion about the mis-use of ALC that is so common, look at The abominable ALC.
Figure 7 shows the spectrum when the ptt button is pressed and released repeatedly. The FT-1000D is perfectly well-behaved here.
