SM 5 BSZ - Dynamic range measurements: FT817 (IV3GBO) Sept 2003
(Aug 12 2004)

Setup to measure transmitter spectral purity

These measurements were made with Linrad running on a PentiumIII 600MHz computer with a modified Delta44 soundcard. The 144 MHz signals were converted to audio by use of the WSE converters RX144, RX70, RX10700 and RX2500.

Linrad was run in Tx test mode

The measurement system has much better dynamic range than required for these measurements so no corrections have to be made for the noise contribution from the measurement system.


Spectral purity of a continuous carrier.

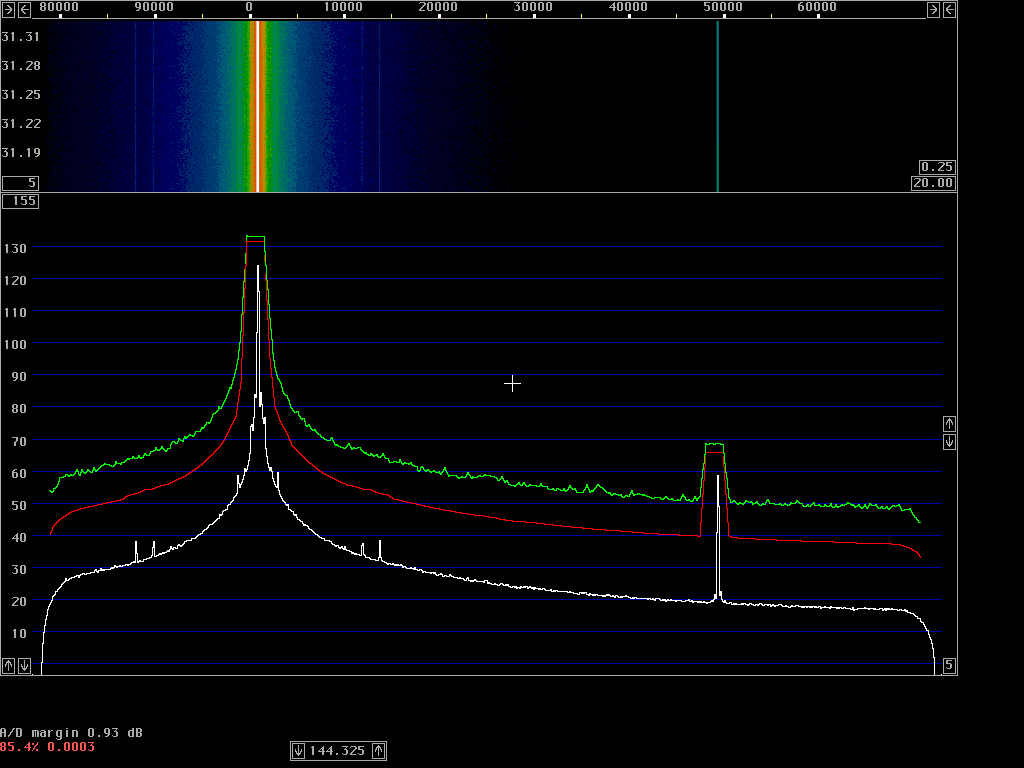
The screen dump for continuous carrier is shown in figure 1.


Fig. 1 Continous carrier of the FT817

The following numbers are extracted from the red curve which is average power in 2.4 kHz:

------------------------------------------------------
   Freq       Coordinates          Level    Sideband  
separation     X        Y         2.4 kHz    noise
   (kHz)    (pixels) (pixels)      (dB)     (dBc/Hz)
     0        258      242          0.0        -
     5        306      460         67.9       101.9
    10        353      487         76.3       110.3
    20        447      511         83.8       117.8
    50        732      538         92.2       126.2
------------------------------------------------------
Spectrum of FT-817 emitting continuous carrier.
Spectral purity of keyed CW transmissions.

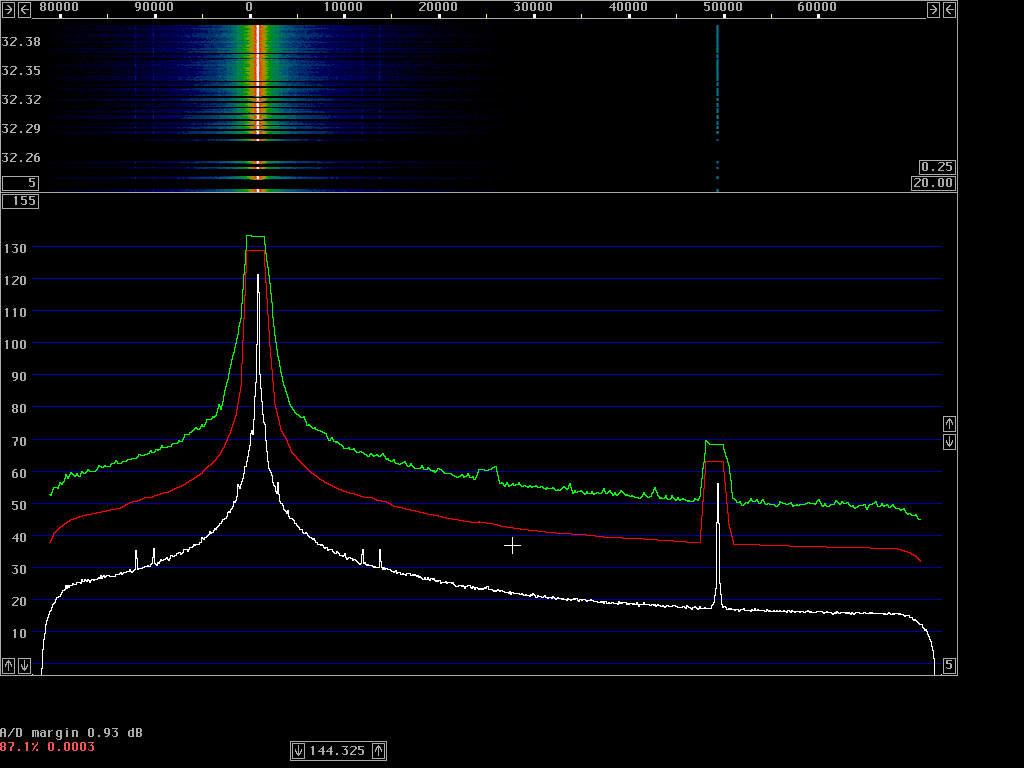
The screen dump for hand keyed Morse code transmissions is shown in figure 2.


Fig. 2 Morse code transmission of the FT817
There are no visible keying clicks. The average spectrum is practically identical with the pure carrier spectrum, it is just shifted downwards by 3dB because the key is up about 50 % of the time. The green curve, the peak power is not above what is expected for white noise.


Spectral purity of voice SSB transmissions.

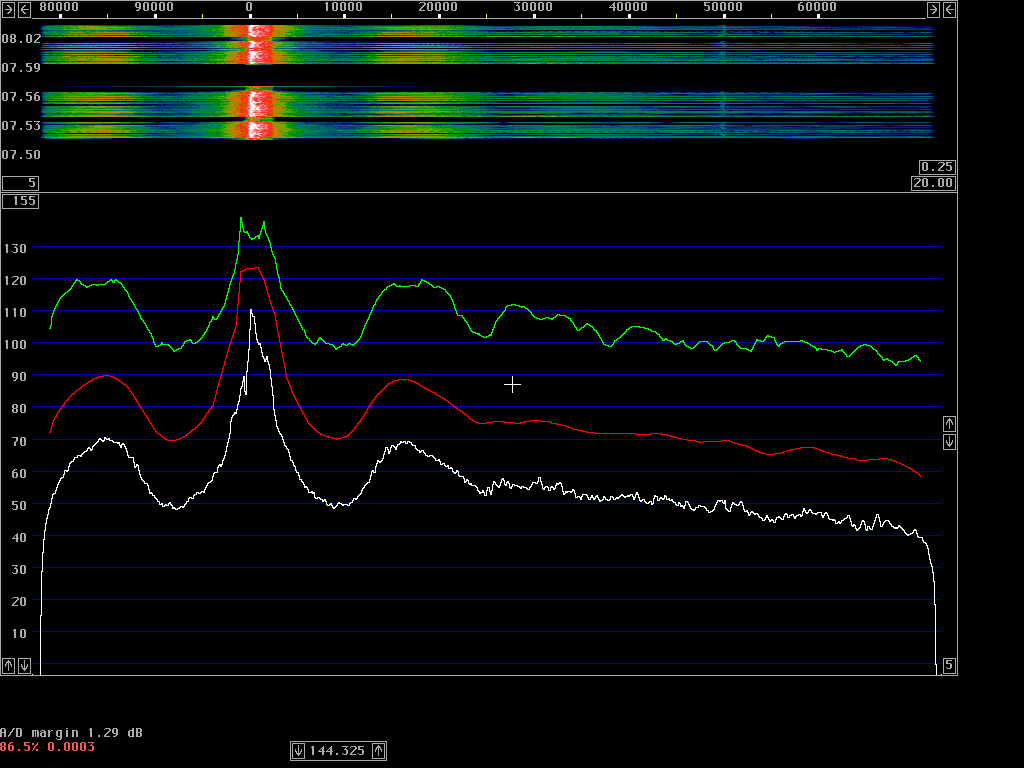
The screen dump for voice SSB is shown in figure 3.


Fig. 3 SSB transmission of the FT817. See text.


The spectrum of the SSB transmission is absolutely horrible!! Wide spurs at +/- about 17 kHz have a peak power level only 14 dB below the main signal peak power. The reason for these very ugly spurs is instability in the ALC loop. The sidebands may disappear at low power levels, but they also disappear at very high power levels if the peak power is fairly constant, like when saying "aaaaaaaaaaaaaaa" into the microphone with high voice.

The spectrum shown here is typical for the FT-817. Several other transceiver models show similar very strong spurious emissions due to ALC instabilities.

To SM 5 BSZ Main Page