Tested amplifiers.
-
1) MGF1425old This is the LNA that I used for EME in
the time period 1993 to 2001. This amplifier has never been
modified or adjusted since it was built in 1993 and the FET has
never been replaced. This amplifier has some front end selectivity
and uses neutralization.
-
2) MGF1801 This amplifier was built around 1997. It uses a wideband
input with low losses and it is neutralized. It has indicated an NF of
about 0.5 dB at some amateur meeting. In 2012 trimmers were added to adjust
the current as well as voltage. As a result the NF became significantly lower.
-
3) MGF1425 This amplifier was measured at the 7th EME meeting in Bowie
(near Washington DC) in 1996.
It was not well screened at the time, but it showed very low values
at times when no RF was leaking into it. This amplifier is neutralized and
uses a low loss wideband input. In 2012 trimmers were added to allow
voltage and current adjustment. Proper shielding was also added.
-
4) ATF33143 Built in 2001. Neutralized. Trimmers for voltage and current
adjustment added in 2012.
-
5) 2xATF33143 Built in 2001. Two transistors in parallel.
Neutralized. Trimmers for voltage and current adjustment added in 2012.
-
6) ATF33143negimp Built in 2012 with the purpose of demonstrating
negative noise figures on standard NF meters.
This amplifier has positive feedback and provides a return loss of -6 dB.
(The reflected power is 4 times higher than the incident power.
-
7) PSA4-5043 An amplifier with a MMIC from Minicircuits.
-
8) FHX05FA/LG Built Aug 2012 and tuned for optimum NF with Linrad
as a NF meter.
- 9) NONE No amplifier, just a BNC female to BNC female adapter.
Measurement system.
Linrad was running with the SDR-IP at a bandwidth of 1.2 MHz. An SBL1 Schottky diode mixer was connected to the input with a HP8657A as the LO at 134 MHz. In front of the mixer a filter with more than 60 dB attenuation on the mirror frequency 124 MHz was inserted to ensure that all the signal reaching the SDR-IP on 10 MHz originated in 144 MHz. Low noise amplifiers in front of the filter provide a system NF of 3.4 dB. Another HP8657A signal generator was connected to precision attenuators to provide an accurate match to 50 ohms as measured on the connector used to connect to the different amplifiers under test.Measurement conditions.
All measurements on this page were made on Aug 13 2012. This day with stable weather the air pressure was reported to be 1024 hPa here in Eskilstuna. The table in Handbook of Chemistry and Physics gives the temperature of boiling water for pressures in mm Hg. 1024 hPa converts to 768.0 mmHg. My lab is 15 meters above sea level so the pressure in my lab should be 766.6 mm Hg. The handbook tells me that pure water would boil at 100.606 °C. For the experiment "battery water" was used. It is demineralized water with a conductivity of less than 5 uS/cm. Hopefully this water is pure enough to boil and freeze at the expected temperatures 0.00 and 100.61 °C which converts to 273.15 K and 373.76 K.Screen dumps.
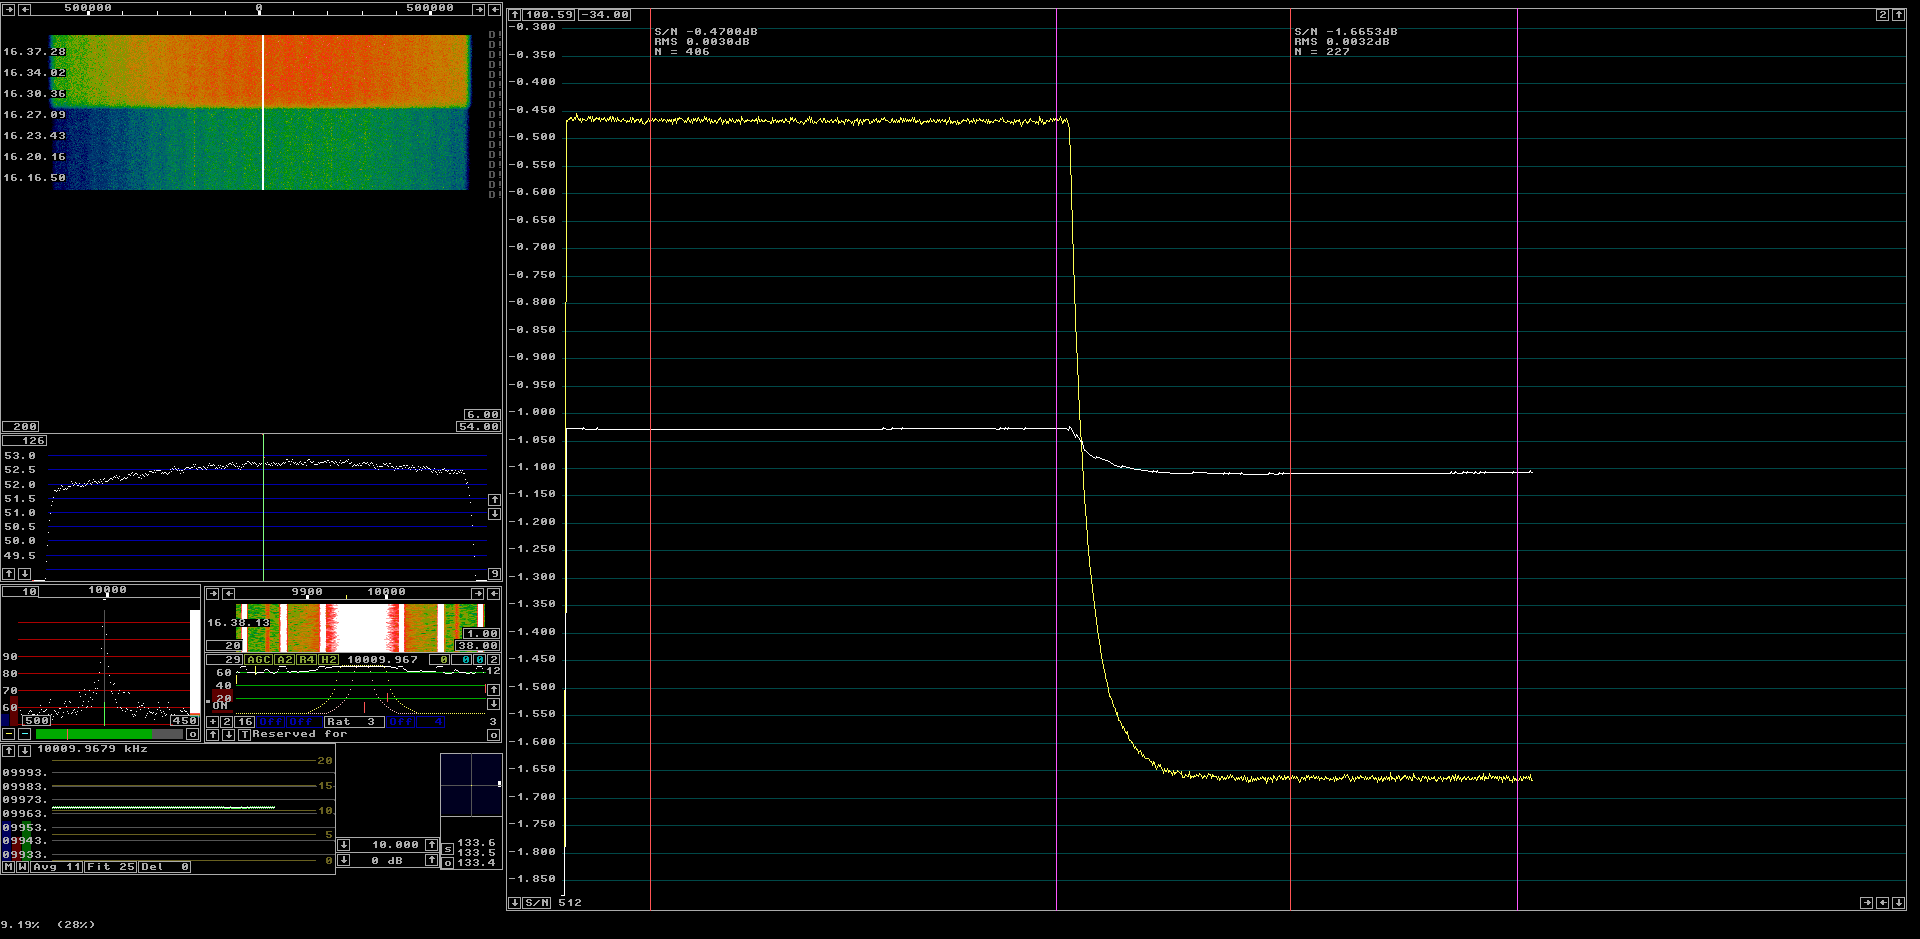
| |||||||||||||||||||||||||||||||||||||||||||||||||||||||||||||||||||||||
| MGF1425old. The Y-factor is 1.195 dB. | |||||||||||||||||||||||||||||||||||||||||||||||||||||||||||||||||||||

| |||||||||||||||||||||||||||||||||||||||||||||||||||||||||||||||||
| MGF1801. The Y-factor is 1.272 dB. | |||||||||||||||||||||||||||||||||||||||||||||||||||||||||||||||
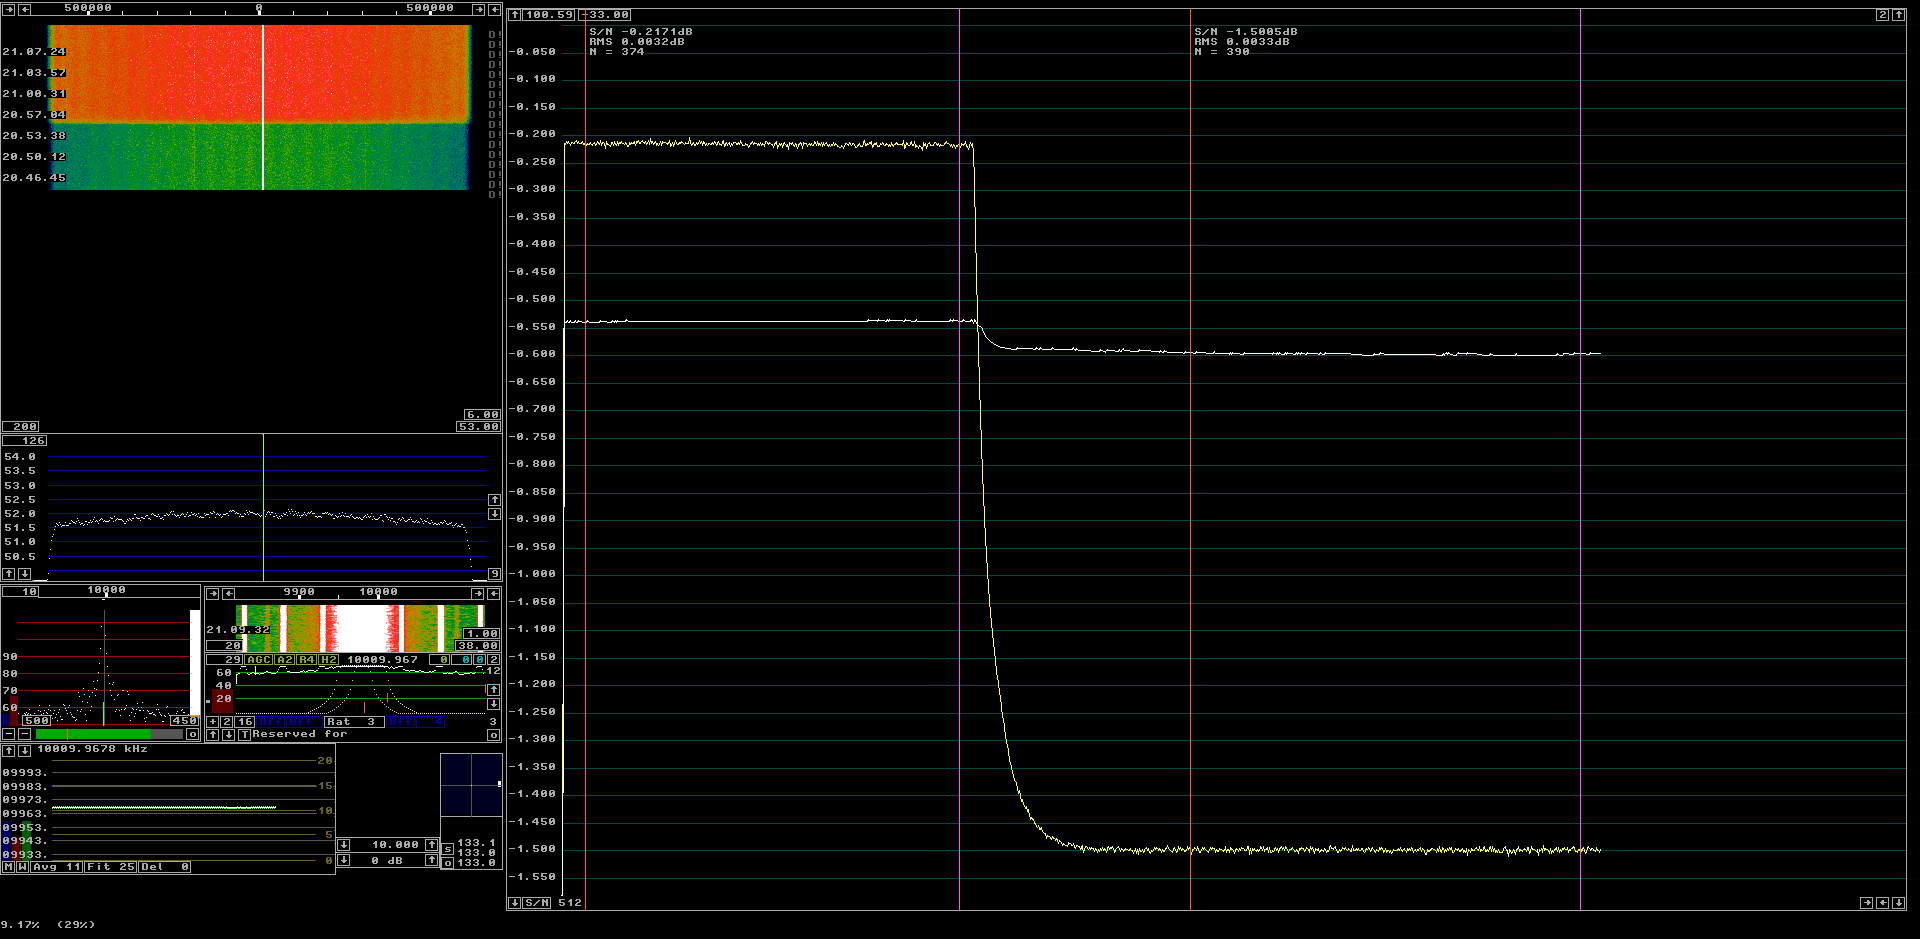
| |||||||||||||||||||||||||||||||||||||||||||||||||||||||||||
| MGF1425. The Y-factor is 1.272 dB. | |||||||||||||||||||||||||||||||||||||||||||||||||||||||||
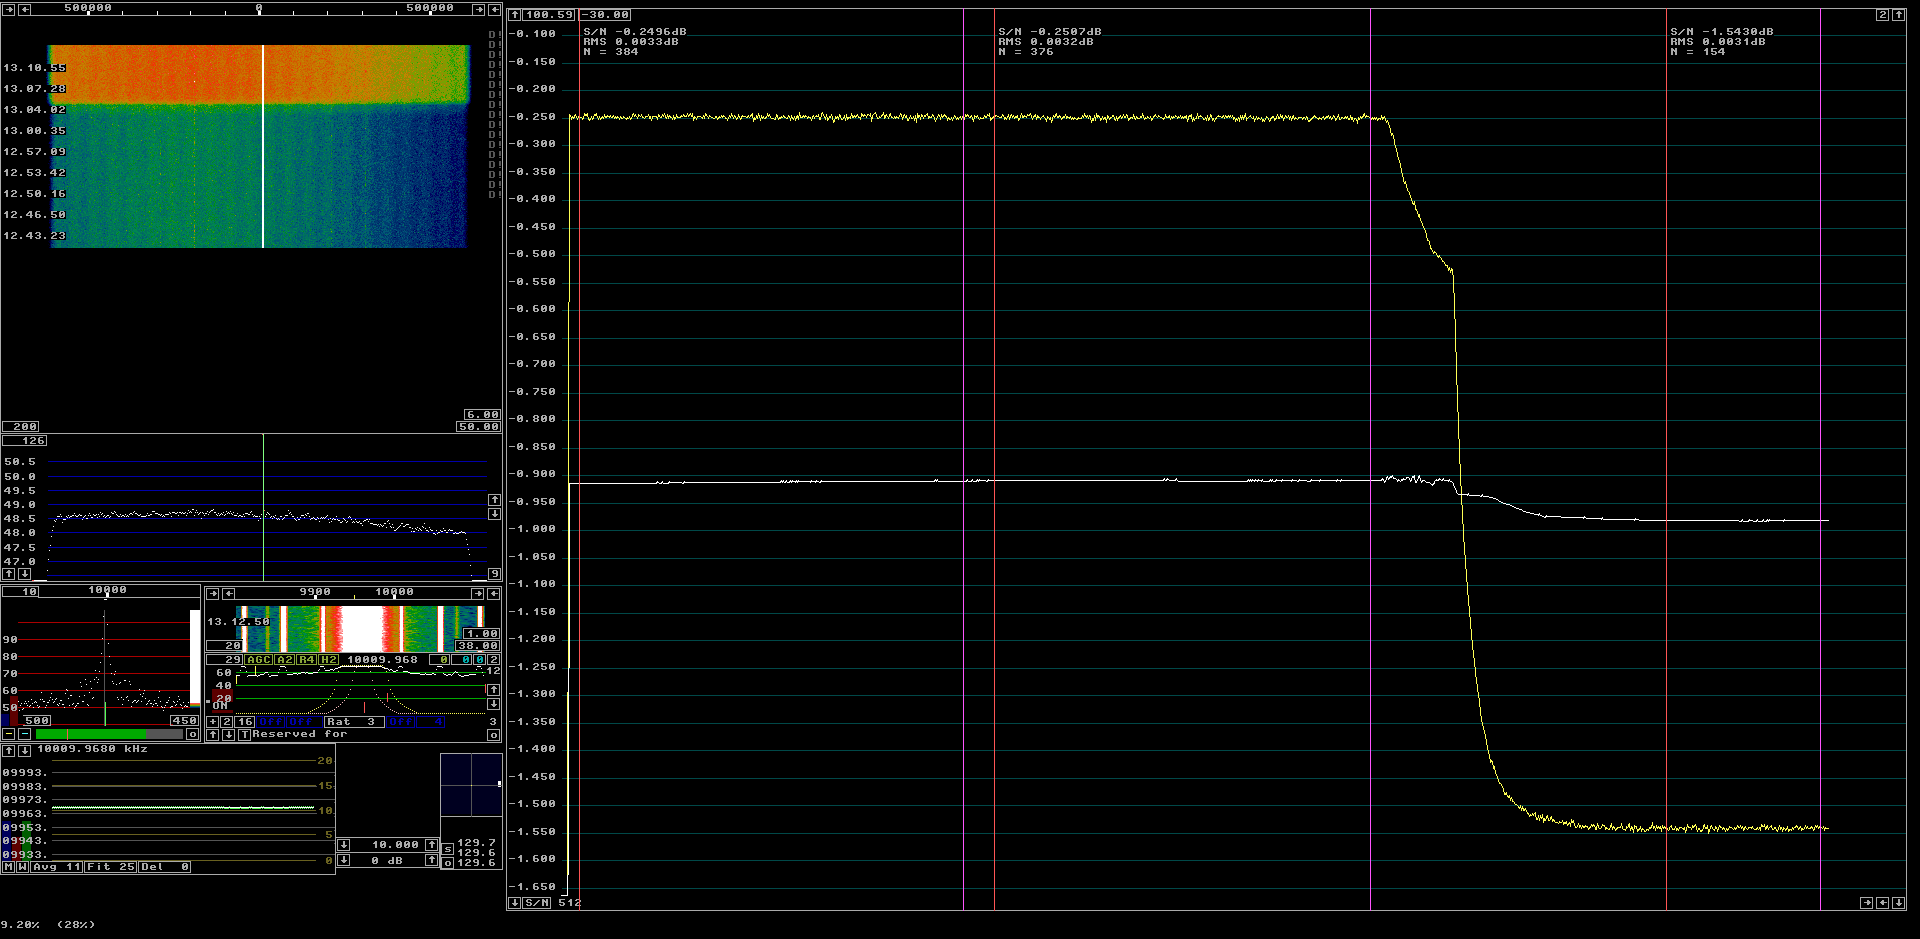
| |||||||||||||||||||||||||||||||||||||||||||||||||||||
| ATF33143. The Y-factor is 1.293 dB. | |||||||||||||||||||||||||||||||||||||||||||||||||||

| |||||||||||||||||||||||||||||||||||||||||||||||
| 2xATF33143. The Y-factor is 1.263 dB. | |||||||||||||||||||||||||||||||||||||||||||||

| |||||||||||||||||||||||||||||||||||||||||
| ATF33143negimp. The Y-factor is 1.297 dB. | |||||||||||||||||||||||||||||||||||||||

| |||||||||||||||||||||||||||||||||||
| PSA4-5043. The Y-factor is 1.193 dB. | |||||||||||||||||||||||||||||||||
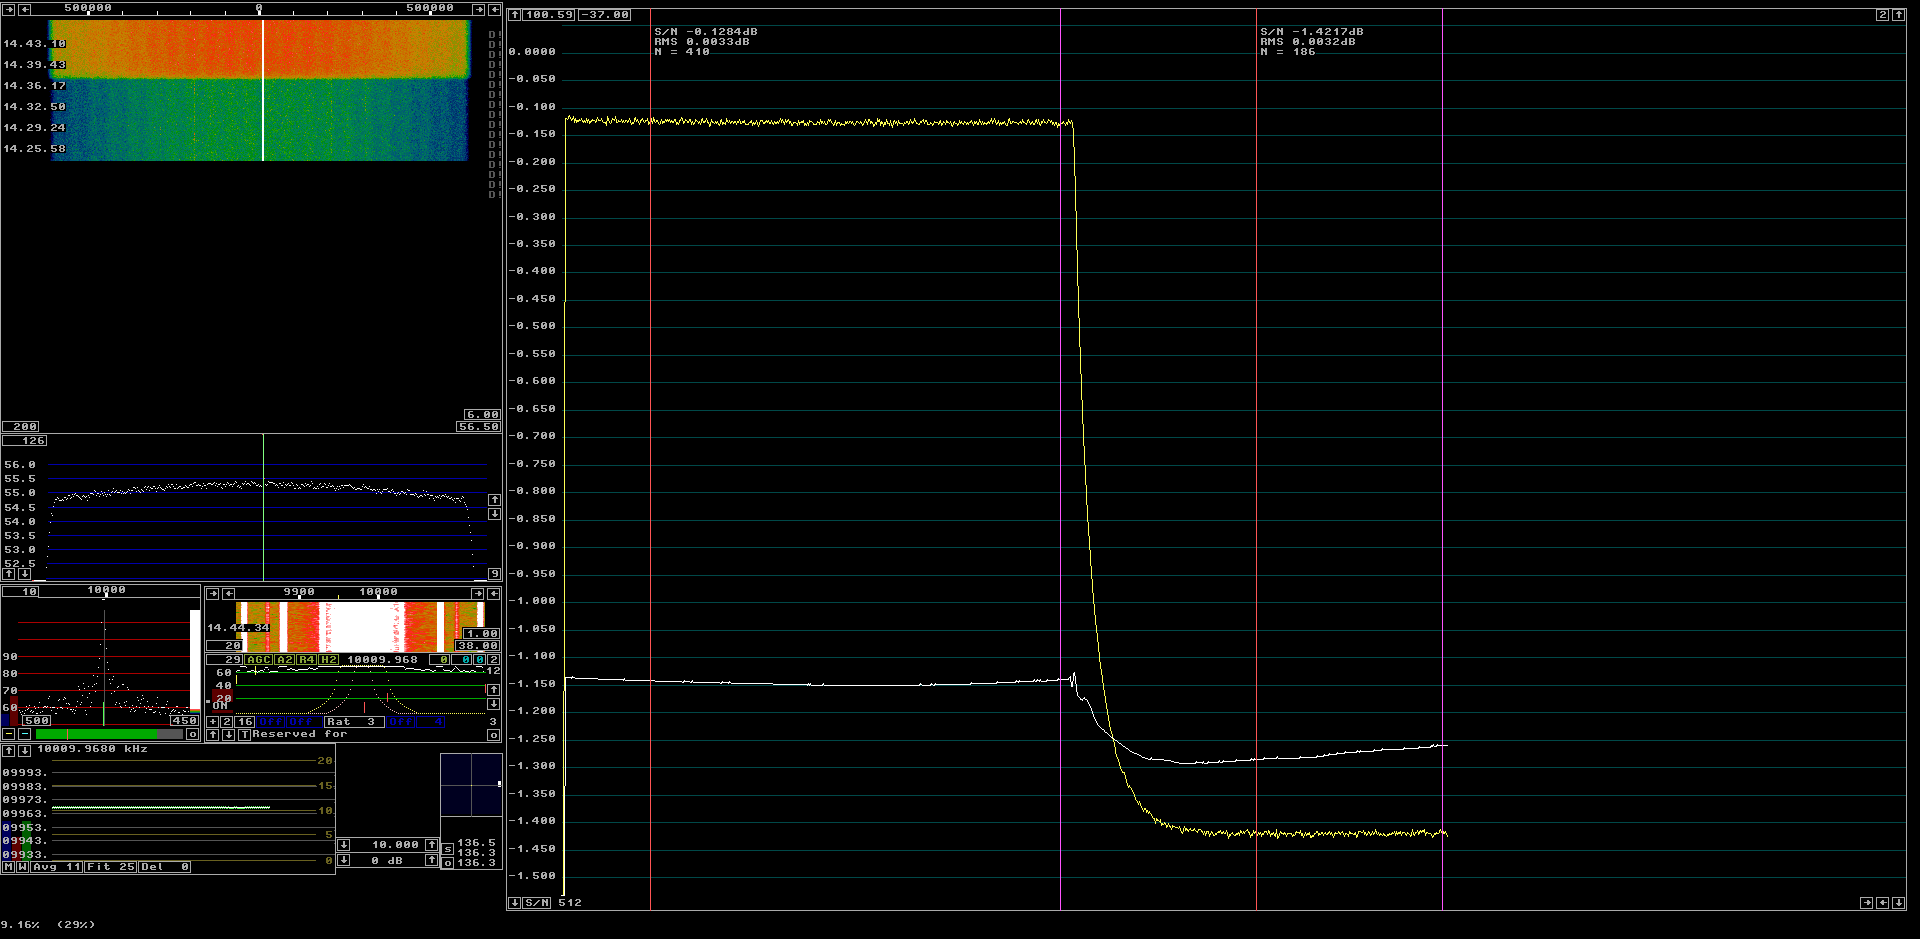
| |||||||||||||||||||||||||||||
| FHX05FA/LG. The Y-factor is 1.293 dB. | |||||||||||||||||||||||||||
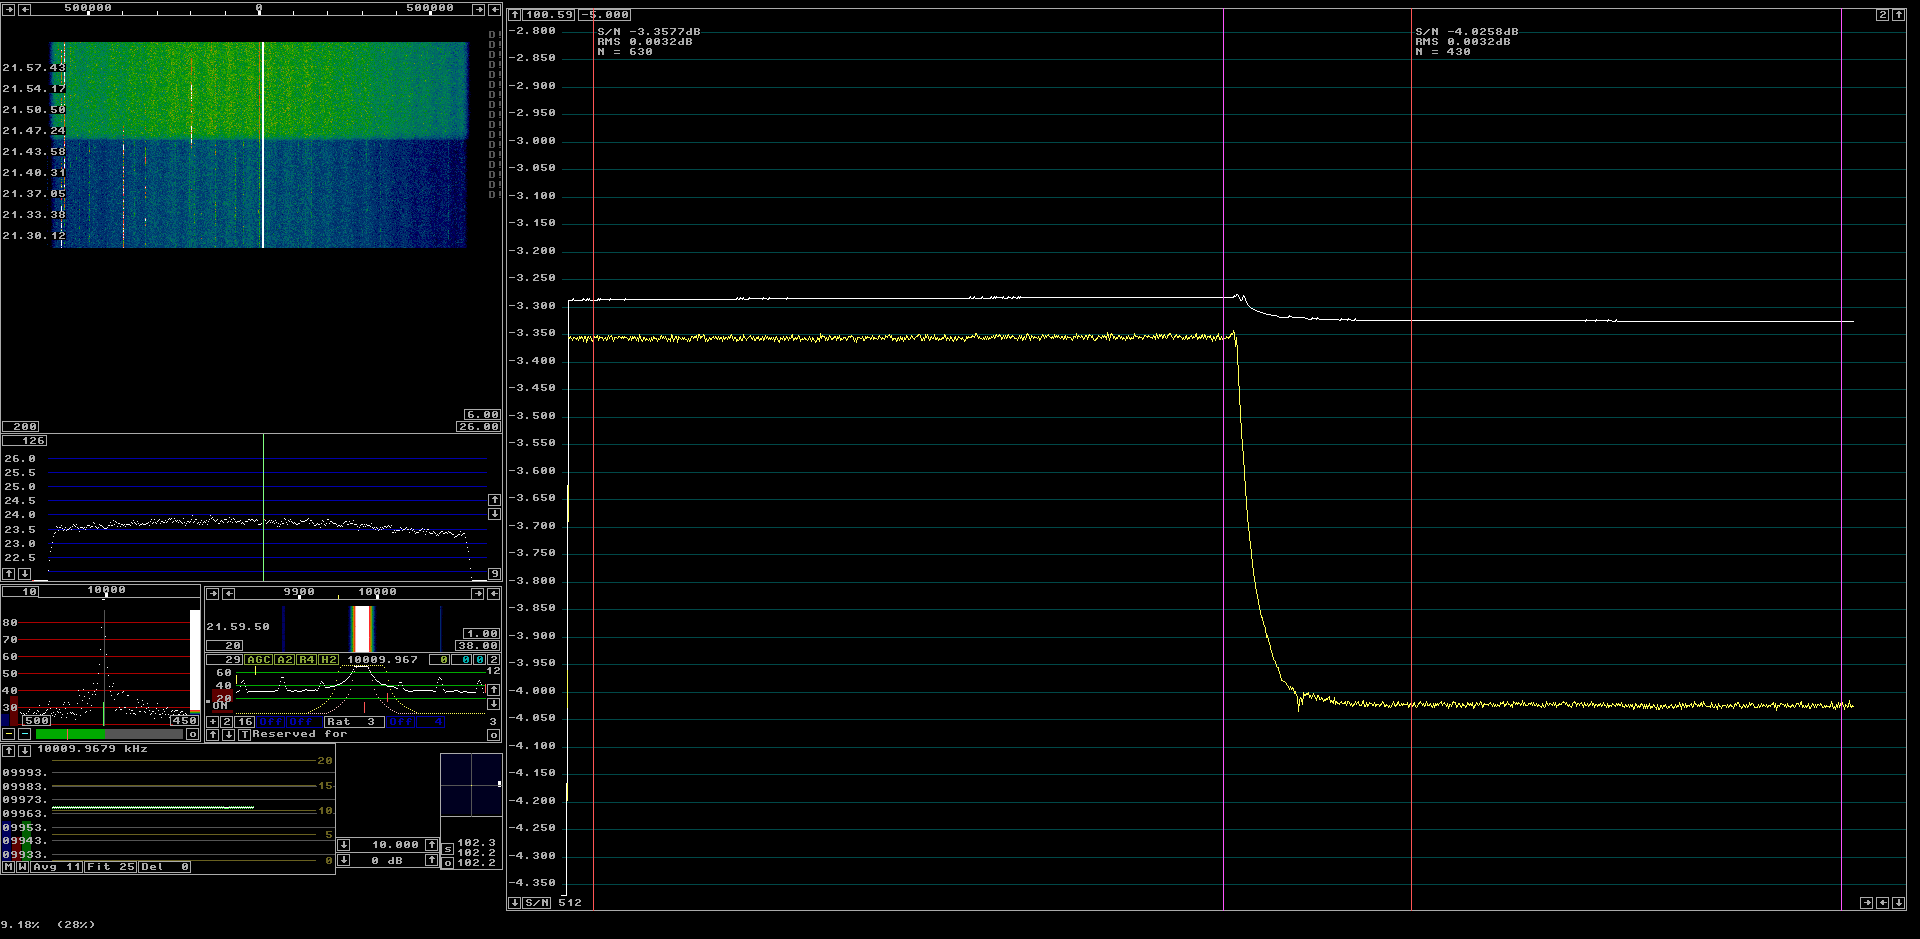
| |||||||||||||||||||||||
| NONE. The Y-factor is 0.668 dB. | |||||||||||||||||||||
Evaluation.
The total noise is the sum of the thermal noise of the attenuator, the
noise from the tested amplifier and the noise from subsequent stages in the
system 2nd Tinp.
The Y-factor is the ratio of two such sums like this:
| |||||||||||||||||||
   Unit        Y-factor   Y-factor    Gain   2nd Tinp   TLNA    NF
  (name)         (dB)    (lin.pow)    (dB)    (K)     (K)      (dB)
ATF33143negimp   1.297    1.34803    32.8     0.17   15.76    0.230
FHX05FA/LG       1.293    1.34679    34.1     0.13   16.84    0.245
ATF33143         1.293    1.34679    27.4     0.60   16.37    0.238
MGF1801          1.272    1.34029    28.0     0.53   21.98    0.317
MGF1425          1.272    1.34029    30.8     0.28   22.23    0.321
2xATF33143       1.263    1.33752    28.5     0.47   24.47    0.352
MGF1425old       1.195    1.31674    31.2     0.25   44.24    0.617
PSA4-5043        1.193    1.31613    23.8     1.38   43.73    0.610
NONE             0.668    1.16627     0.0     332
Table 1.. | |||||||||||||||||
|
The results in table 1 should rank all the amplifiers properly. There are however some systematic errors that should be taken into account. The cable from the attenuator to the test object is 80 mm of Suhner 02250 high temperature teflon cable (as measured from the copper tube responsible for water-proofing.) The nominal loss is 0.33 dB/m at 150 MHz so this cable would add 0.026 dB to the NF result if it were kept at room temperature over all the 80 mms of its length. It seems reasonable to assume it adds 0.015 dB to the result. In this experiment, a second cable, 225 mm of RG223U was also inserted. The nominal attenuation is 0.16 dB/m so this cable contributes 0.036 dB. The correction for cable losses should be about -0.05 dB. Table 2 shows the corrected results from table 1 and a comparison with a previous comparison of these amplifiers with Linrad used as a NF meter. (That measurement only gives a relative dB scale and the zero point was a guess based on a previous hot/cold measurement.) | |||||||||||||||
   Unit       NF(table 1)    NF(previous)      Diff      Error     NF(prev.corrected)
  (name)         (dB)          (dB)           (dB)       (dB)            (dB)
ATF33143negimp   0.180         0.205          0.025     -0.009          0.171
FHX05FA/LG       0.195         0.240          0.045      0.011          0.206
ATF33143         0.188         0.271          0.083      0.049          0.237
MGF1801          0.267         0.304          0.037      0.003          0.270
MGF1425          0.271         0.266         -0.005      0.039          0.232
2xATF33143       0.302         0.327          0.025     -0.009          0.293
MGF1425old       0.567         0.557         -0.010     -0.044          0.523
PSA4-5043        0.560         0.631          0.071      0.037          0.597
                                         avg= 0.034
Table 2. The relative NF values (previous) in table 2 have to be shifted
by the average difference 0.034 dB downwards.
That seems to have been the error in the zero point of the
relative NF measurements.
.
| |||||||||||||
|
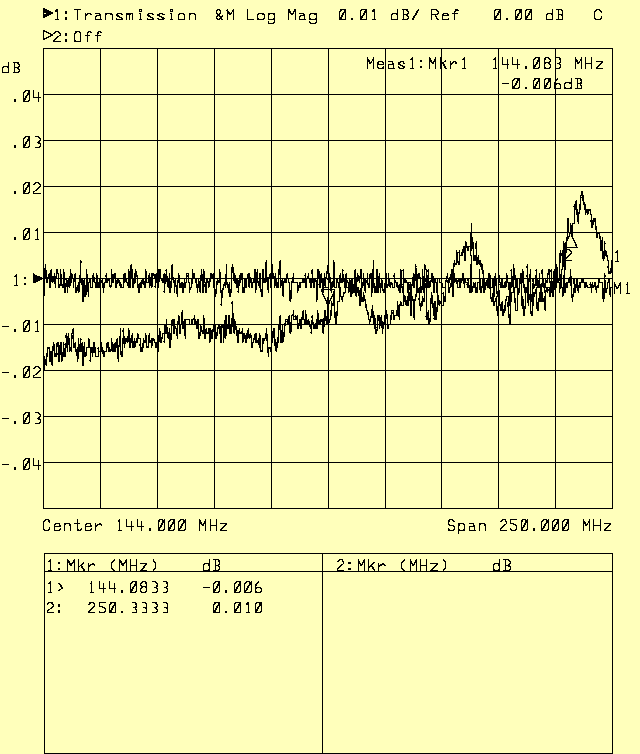
Table 2 compares measurements obtained by two different methods. The biggest differences are just below 0.05 dB which means that the error in individual measurements is below 0.03 dB but there is an unknown systematic error that is equal for all amplifiers that is related to errors in the noise temperatures due to cable losses. That error is probably very small. The attenuator is made with standard surface mount resistors. The attenuation varies with temperature. Figure 8 shows the change with temperature. | |||||||||||
| |||||||||
| Fig. 8. Attenuation vs temperature. The instrument is calibrated to show zero transmission loss with the attenuator at 0 °C. The transmission loss changes by something in the order of 0.01 dB when the attenuator is heated to 100 °C. | |||||||
It is not obvious how to correct the NF results by use of the data from figure 8. Not only the attenuation changes with the temperature. Also the impedance changes a little. There may be a small systematic error here. If the increased loss is due to changed matching to the network analyzer there should be no correction to the NF results, but if the 0.01 dB signal loss is resistive the NF values in table 2 would be too good by 0.01 dB. There could be both phenomena with opposite signs so there is an unknown systematic error here, but probably it is not larger than 0.01 dB. The amplifiers on this page were brought to the 15th INTERNATIONAL EME CONFERENCE and measured there in several ways. This link results from EME 2012. shows the raw data as well as the conclusions I think one can draw from a comparison with the data in table 2. (Table 2 was published before the meeting.) Impedance variations.Figure 9 shows the impedance change between 0 and 100 °C. The change is 0.7 ohms. | |||||

| |||
| Fig. 9. Impedance vs temperature. The instrument is calibrated to show 50 ohms with the attenuator at 0 °C. The impedance change at 144 MHz is 0.7 ohms. | |