Traditional NF measurements.
Traditional NF meters give large uncertainties for low noise figures. The Agilent NF uncertainty calculator shows that the accuracy is no better than ± 0.25 dB. In case the meter shows NF=0.30 dB the real value could be anything between 0.05 and 0.55 dB. The corresponding noise temperature range is 3.4 K to to 39 K.Despite the large uncertainties amateurs traditionally bring NF meters to various meetings and record NF values with two decimals even though it is well known that the uncertainty makes the data useless and can not tell whether one amplifier is better or worse than another. Today a low noise amplifier (LNA) typically has a noise figure that is smaller than the uncertainty. The error depends on the design of the particular LNA. It is possible that two amplifiers that give exactly the same reading on a NF meter differ very much when used on an antenna. For that reason common knowledge is that amplifiers should be tuned when connected to the antenna and not on a NF meter.
Relative NF measurements.
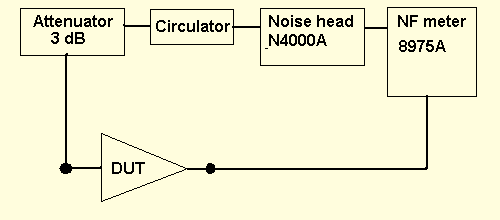
The absolute NF is not really very important. A procedure that would rank LNAs in the correct order would be very useful even if all the NF values have a large error in common. With a reliable relative NF meter we can tune and compare amplifiers and select one to use as a reference to calibrate different relative NF meters to each other. We can then say that one particular amplifier is better or worse than the reference amplifier with a high accuracy and the numbers would always tell correctly whether one LNA is better than another on an antenna. (Provided that the antenna is reasonably well matched to 50 ohms.)The ideal setup for using a conventional NF meter for relative NF measurements is as illustrated in figure 1.

| |||||||||||||||||||||||||||||||||
| Figure 1. Arrangement for precision measurements of relative noise figures. | |||||||||||||||||||||||||||||||
The purpose of the circulator on the noise head output is to make sure that the impedance at the LNA input is exactly the same regardless of whether the the noise head is in the on or in the off state. Dual circulators or isolators can easily be tweaked for an isolation of 70 dB or more by use of small magnets. The NF errors caused by variations in the noise head can be as large as 0.5 dB. Much less than 70 dB isolation is required to bring this error to below 0.001 dB. The fixed attenuator at the DUT input serves the purpose of presenting a reasonable load at all frequencies. Some amplifiers might oscillate without this attenuator. It can be omitted if such amplifiers will not be measured. The variable attenuator after the DUT should be used to set the same gain for all tested amplifiers as indicated by the NF meter. That will eliminate non-linearity errors in the NF meter. The circulator at the input of the NF meter is added to make sure that the impedance seen by the DUT is very close to 50 ohms even when the variable attenuator is set to low values. That helps to make the measured gain values more accurate. The setup of figure 1 should give very accurate relative NF values. My guess is that it would allow the comparison with three decimal places for LNAs with high gain and wide bandwidth. When using modern NF meters, the variable attenuator can be omitted because modern instruments have excellent linearity by use of A/D converters and computation of the true RMS power. When amplifiers with very high gain are measured, the circulator at the input of the NF meter can be omitted. The uncertainty coming from the unknown matching at the instrument input causes an uncertainty in the gain that will cause an uncertainty in the contribution to the Y-factor by the instrument itself. The unknown mis-match error becomes divided by the DUT gain in the NF evaluation. Relative measurements were made at the 15th INTERNATIONAL EME CONFERENCE 2012 by HB9BBD using the setup in figure 2. | |||||||||||||||||||||||||||||

| |||||||||||||||||||||||||||
| Figure 2. Setup for a series of measurements made by HB9BBD at the EME meeting in Cambridge 2012. | |||||||||||||||||||||||||
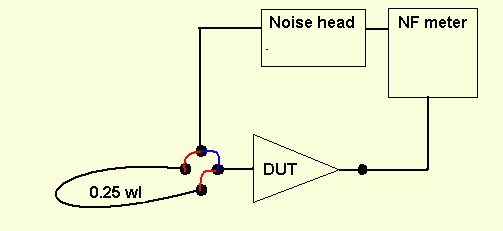
Another type of relative NF measurements is shown in figure 3. Here a quarter wave cable is used to change the transmission line length between the noise head and the DUT. As a result two different NF values are obtained and both of them contain an error caused by the impedance variations between the hot and the cold noise head. The quarter wave cable will mirror the impedance on the midpoint as seen on a Shmit Chart and as a consequence the magnitude of the impedance change is the same but the sign is opposite. The gain change in the DUT should therefore be the same but with opposite sign so by taking the average one should eliminate the error caused by gain variations by cancellation. | |||||||||||||||||||||||

| |||||||||||||||||||||
| Figure 3. Disconnecting the DUT from the cable from the noise head (blue) and inserting a quarter wave cable (red) will change the sign of the error caused by the variation of the noise head impedance. | |||||||||||||||||||
The 0.25 wl cable will of course add a small loss which has to be taken into account. Relative measurements were made at the 15th INTERNATIONAL EME CONFERENCE 2012 by G3XDY using the setup in figure 3 with a HP8970A and a HP346A noise source. Those measurements include a second cable of length 0.125 wavelengths by which two more points are obtained. Those two correspond to mirror images on a perpendicular line in the Shmit chart and they should produce the same average. Evaluation of the 8970A measurements at EME 2012.The raw data as published by G3XDY can be downloaded here: eme2012nf.pdf Most amplifiers were measured with the G4DDK noise head. The raw data and the averages are listed in table 1. The 0.25 wavelength cable was made from RG55B/U cable. That cable has a nominal impedance of 53.5 ohms I did not know until looking it up while writing this page. It is an error, but since the NF of the tested amplifiers is relatively insensitive to the source impedance the uncertainty introduced by this error is small. The impedance is converted from 50 to 56 ohms as measured with a network analyzer using a precision 50 ohm dummy load. The expected change of the NF is small and can be estimated from the data in table 3 here. The nominal attenuation is about 0.17 dB/m on 144 MHz. With its length 335 mm the 0.25 wl cable should have an attenuation of 0.057 dB. The 0.125 wl cable was made from RG223 cable with a nominal loss of 0.16 dB/m. The attenuation should be 0.027 dB. | |||||||||||||||||
   Unit         Cable    Loss     Measured   Average    NF
  (name)         (wl)    (dB)       (dB)      (dB)     (dB)
--------------------------------------------------------------------
ATF33143negimp    0       0         0.02
                 0.25    0.057      0.27      0.117
                 0.125   0.027      0.09
                 0.375   0.084      0.26      0.120    0.12 (0.003)
--------------------------------------------------------------------
FHX05FA/LG        0       0         0.13
                 0.25    0.057      0.28      0.177    0.17
--------------------------------------------------------------------
MGF1425           0       0         0.13
                 0.25    0.057      0.28      0.177    0.17
--------------------------------------------------------------------
ATF33143          0       0         0.07
                 0.25    0.057      0.25      0.132
                 0.125   0.027      0.14
                 0.375   0.084      0.25      0.140    0.14 (0.008)
--------------------------------------------------------------------
MGF1801           0       0         0.12
                 0.25    0.057      0.28      0.172
                 0.125   0.027      0.20
                 0.375   0.084      0.28      0.185    0.18 (0.013)
--------------------------------------------------------------------
2xATF33143        0       0         0.20
                 0.25    0.057      0.29      0.217
                 0.125   0.027      0.14
                 0.375   0.084      0.39      0.210    0.21 (0.007)
--------------------------------------------------------------------
MGF1425old        0       0         0.43
                 0.25    0.057      0.51      0.442    0.44
--------------------------------------------------------------------
PSA4-5043         0       0         0.52
                 0.25    0.057      0.57      0.517    0.52
--------------------------------------------------------------------
HB9DRI MGF1801    0       0         0.22
                 0.25    0.057      0.33      0.247    0.25
--------------------------------------------------------------------
Table 1. Measurements by G3XDY at EME 2012 with the
G4DDK noise head.
Measured: Raw data as published by G3XDY. Average: The average of two measurements that differ by 0.25 wl. The average column includes the correction for cable losses. NF: the result for each amplifier. Note that this result has a common error attributable to the calibration error of the noise head. For amplifiers measured with four cable lengths the difference between the two averages is given within parenthesis) | |||||||||||||||
|
Table 2 shows a comparison of the data from table 1 with NF measurements that were published before the conference. Those measurements were made with the hot/cold method using Linrad with an ice/water slurry and boiling water. | |||||||||||||
   Unit           NF           NF           NF       Diff        Diff
                table 1     hot/cold       Rel.     hot/cold     Rel.
  (name)         (dB)         (dB)         (dB)      (dB)       (dB)
ATF33143negimp   0.12        0.180        0.171     -0.060     -0.051
FHX05FA/LG       0.17        0.195        0.206     -0.025     -0.036
ATF33143         0.14        0.188        0.237     -0.048     -0.097
MGF1801          0.18        0.267        0.270     -0.087     -0.090
MGF1425          0.17        0.271        0.232     -0.101     -0.062
2xATF33143       0.21        0.302        0.293     -0.092     -0.083
MGF1425old       0.44        0.567        0.523     -0.127     -0.083
PSA4-5043        0.52        0.560        0.597     -0.040     -0.077
Average                                              -0.073     -0.072
Table 2. Comparison of the result from EME 2012 measurements
with the G4DDK noise head with NF values measured with Linrad
and published before the conference.
.
| |||||||||||
|
Table 2 suggests that there is an error of 0.07 or 0.08 dB in the calibration of the G4DDK noise head. Some measurements were made with the G4SWX noise head. They are evaluated in table 3. | |||||||||
   Unit         Cable    Loss     Measured   Average    NF
  (name)         (wl)    (dB)       (dB)      (dB)     (dB)
-------------------------------------------------------------
ATF33143negimp    0       0         0.25
                 0.25    0.057      0.46      0.327    0.33
-------------------------------------------------------------
GI1CET/WA2ODO     0       0         0.25
                 0.25    0.057      0.31      0.251
                 0.125   0.027      0.20
                 0.375   0.084      0.42      0.255    0.25 (0.004)
-------------------------------------------------------------
Table 3.Measurements by G3XDY at EME 2012 with the
G4SWX noise head.
Measured: Raw data as published by G3XDY. Average: The average of two measurements that differ by 0.25 wl. The average column includes the correction for cable losses. NF: the result for each amplifier. Note that this result has a common error attributable to the calibration error of the noise head. | |||||||
|
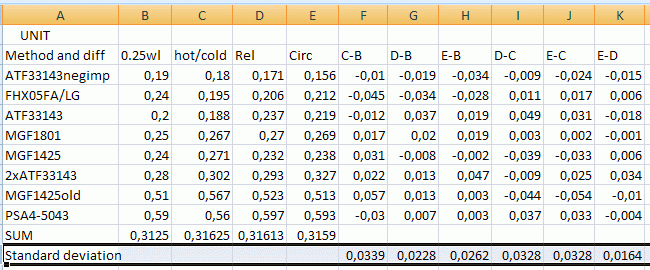
Five amplifiers were measured using two averages. The raw data does not look particularly convincing at a first sight, but the evaluation shows a surprisingly good agreement between the averages with and without the 0.125 wl cable. The largest discrepancy is 0.023 dB, the second largest 0.013 dB while the other three are below 0.01 dB. Since the raw data only has two decimals the errors are not larger than the expected rounding errors. Only one amplifier was measured with both noise heads. The results differ by 0.21 dB which means that the correction to apply for the G4SWX noise head should be -0.14 dB while the correction for the G4DDK noise head should be +0.07 dB. Table 4 lists the NF results obtained above. | |||||
   Unit           NF1        NF2        NF3       NF4       NF2-NF1     NF3-NF1    NF3-NF2
                0.25wl    hot/cold     Rel.   Circulator
  (name)         (dB)       (dB)       (dB)      (dB)        (dB)        (dB)       (dB)
ATF33143negimp   0.19       0.180     0.171       ?         -0.010      -0.019     -0.009
FHX05FA/LG       0.24       0.195     0.206       ?         -0.045      -0.034      0.011
ATF33143         0.20       0.188     0.237       ?         -0.012       0.037      0.049
MGF1801          0.25       0.267     0.270       ?          0.017       0.020      0.003
MGF1425          0.24       0.271     0.232       ?          0.031      -0.008     -0.039
2xATF33143       0.28       0.302     0.293       ?          0.022       0.013     -0.009
MGF1425old       0.51       0.567     0.523       ?          0.057       0.013     -0.044
PSA4-5043        0.59       0.560     0.597       ?         -0.030       0.007      0.037
HB9DRI MGF1801   0.32         -         -             RMS    0.032       0.021      0.044
GI1CET/WA2ODO    0.11         -         -
Table 4. NF1 is measurements using a 0.25 wl cable with the
0.07 dB correction on the noise head obtained from a comparison
with data obtained with ice and boiling water.
NF2 is from ice/boiling water measurements.
NF3 is relative NF using Linrad.
The RMS deviations show that the best similarity is between the NF-meter results
using a 0.25 wl cable and a 0.07 dB correction and the relative NF measurements
made by using Linrad as a NF meter.
The hot/cold measurements are less accurate, but they do give
an absolute NF.
| |||
Evaluation of the measurements with a circulator at EME 2012.The measurements were made by Dominique, HB9BBD with the setup shown in figure 2. The raw data is shown in table 5 with links to the screen dumps from the 8975A. | |
   Unit           NF      NF shifted
  (name)         (dB)       (dB)
ATF33143negimp   3.970      0.145
FHX05FA/LG       4.026      0.201
ATF33143         4.033      0.208
MGF1801          4.083      0.258
MGF1425          4.052      0.227
2xATF33143       4.141      0.316
MGF1425old       4.327      0.502
PSA4-5043        4.407      0.582
HB9DRI MGF1801   4.229      0.404
Table 5. Measurements with a circulator as shown in figure 2. The shifted column is shifted by 3.814 dB to get the best agreement with the ice/hot water measurements. (The same average of all measurements.) | |
