Tested amplifiers.
Besides measuring the PSA4-5043 MMIC from Minicircuits on 144 MHz this page shows measurements of several 144 MHz GAAS FET amplifiers.-
1) MGF1425old This is the LNA that I used for EME in
the time period 1993 to 2001. This amplifier has never been
modified or adjusted since it was built in 1993 and the FET has
never been replaced. This amplifier has some front end selectivity
and uses neutralization.
-
2) MGF1801 This amplifier was built around 1997. It uses a wideband
input with low losses and it is neutralized. It has indicated an NF of
about 0.5 dB at some amateur meeting. In 2012 trimmers were added to adjust
the current as well as voltage. As a result the NF became significantly lower.
-
3) MGF1425 This amplifier was measured at the 7th EME meeting in Bowie
(near Washington DC) in 1996.
It was not well screened at the time, but it showed very low values
at times when no RF was leaking into it. This amplifier is neutralized and
uses a low loss wideband input. In 2012 trimmers were added to allow
voltage and current adjustment. Proper shielding was also added.
-
4) ATF33143 Built in 2001. Neutralized. Trimmers for voltage and current
adjustment added in 2012.
-
5) 2xATF33143 Built in 2001. Two transistors in parallel.
Neutralized. Trimmers for voltage and current adjustment added in 2012.
-
6) ATF33143negimp Built in 2012 with the purpose of demonstrating
negative noise figures on standard NF meters.
This amplifier has positive feedback and provides a return loss of -6 dB.
(The reflected power is 4 times higher than the incident power.
Linrad parameters.
For optimum statistics one should use a flat wide passband. This is ok when measuring NF by use of different temperatures on an attenuator, but not when tweaking an amplifier for lowest possible noise.Calibrating Linrad with the rtl-sdr hardware requires a high pulse repetition frequency and the result is not quite correct due to the low dynamic range. The data into the calibration process is 8 bit only. The parameters used with Linrad for all measurements with Linrad on this page can be downloaded here: nfparms.tbz (2310 bytes) or here: nfparms.zip (4378 bytes)
Measurement conditions.
All measurements on this page were made on Aug 2 2012. This day with stable weather the air pressure was reported to be 1016 hPa here in Eskilstuna, just 1 hPa different from the pressure in Stockholm 100 km away. The table in Handbook of Chemistry and Physics gives the temperature of boiling water for pressures in mm Hg. 1016 hPa converts to 762.0 mmHg. My lab is 15 meters above sea level so the pressure in my lab should be 760.6 mm Hg. The handbook tells me that pure water would boil at 100.022 °C. For the experiment "battery water" was used. It is demineralized water with a conductivity of less than 5 uS/cm. Hopefully this water is pure enough to boil and freeze at the expected temperatures 0.00 °C and 100.02 ° which converts to 273.15 °K and 373.17 °K.The PSA4-5043 MMIC was measured with the rtl-sdr at gain=18 with a NF of 7.0 dB. The other amplifiers were inserted in front of the PSA4-5043 amplifiers and the rtl-sdr gain was set to 6. A stepped attenuator was inserted between the PSA4-5043 amplifier and the rtl-sdr receiver. Table 1 shows the attenuator settings and the associated NF of the system at the PSA4-5043 input. Those values represent the second stage NF that we will need to account for.
   Unit         Att.      NF
  (name)        (dB)     (dB)
MGF1425old       20       9.8
MGF1801          16       6.8
MGF1425          19       8.8
ATF33143         18       8.2
2xATF33143       16       6.8
ATF33143negimp   23      12.5
Table 1. The NF at the measurement system input, the PSA4-5043 MMIC amplifier. | |||||||||||||||||||||||||||||||||||||||||||||||||||||||||||||||
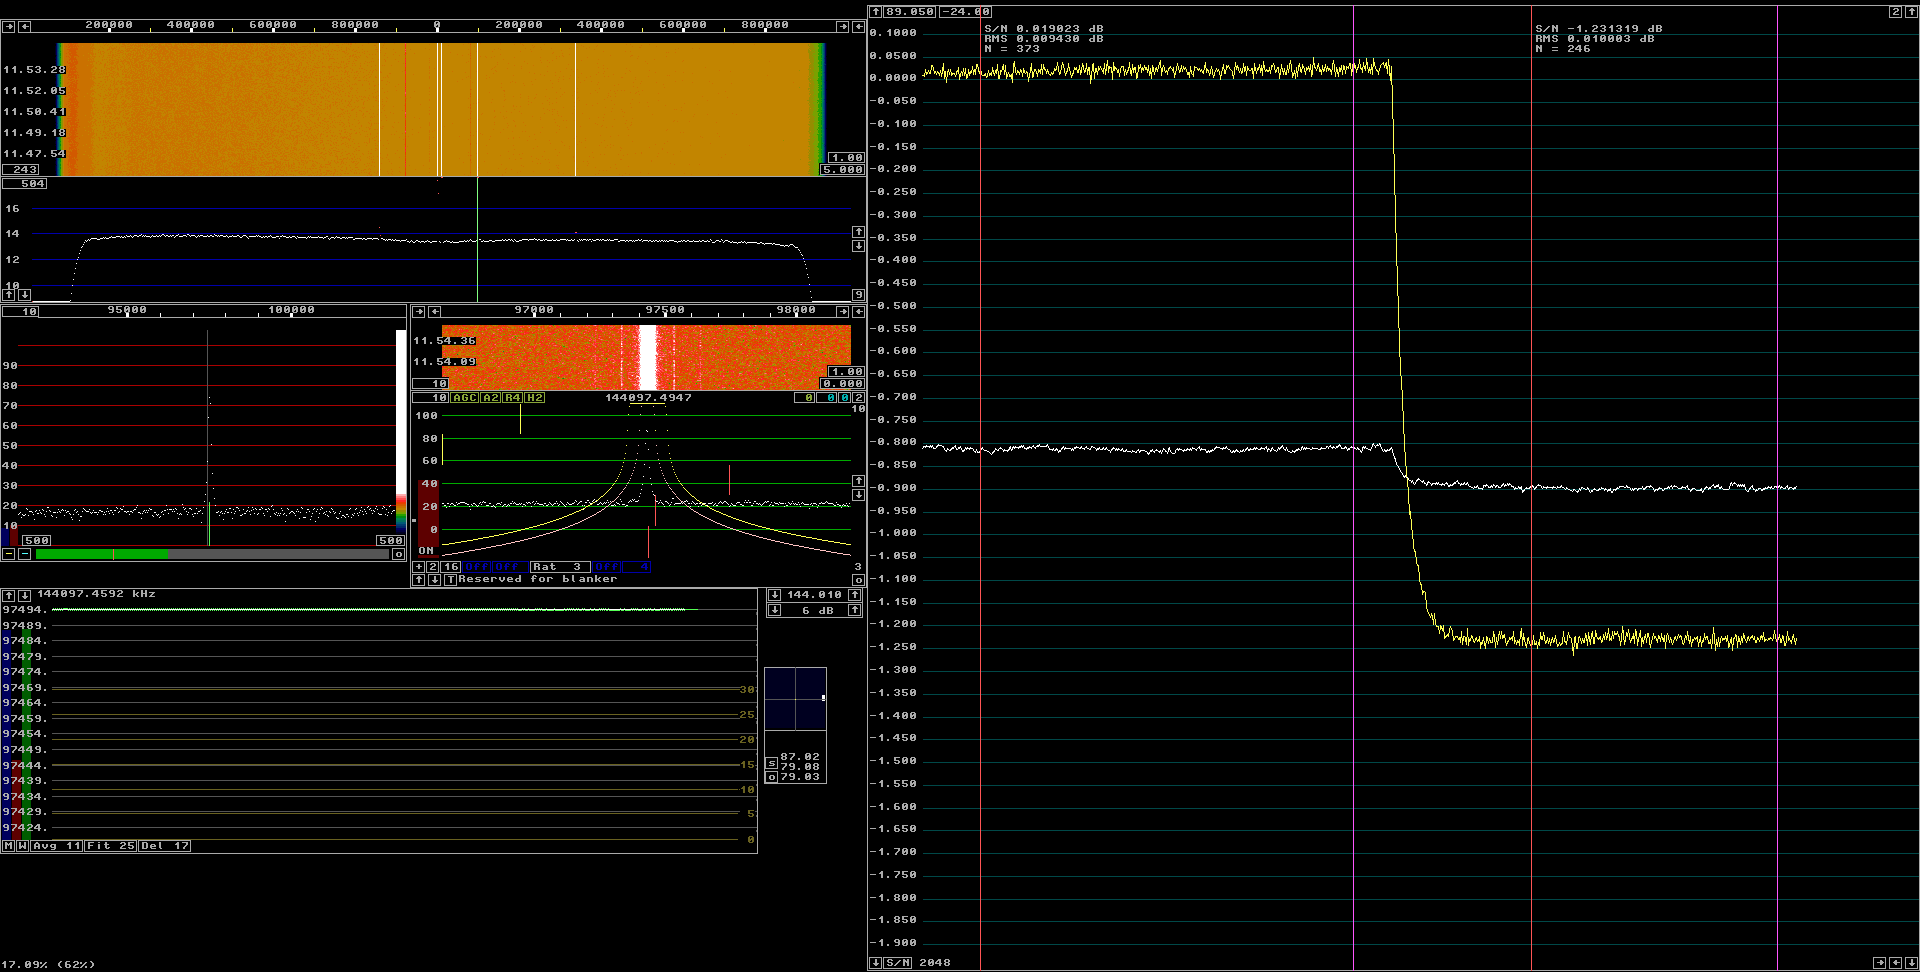
MGF1801Figure 1 shows a screen dump from the experiment with the MGF1801 amplifier. | |||||||||||||||||||||||||||||||||||||||||||||||||||||||||||||
| |||||||||||||||||||||||||||||||||||||||||||||||||||||||||||
| Fig. 1. MGF1801. The Y-factor is 1.231319+0.019023 = 1.250 dB. See text. | |||||||||||||||||||||||||||||||||||||||||||||||||||||||||
The main spectrum is flat within 0.5 dB. Note that the red and blue controls in the high resolution graph are set to low values. That is to make Linrad exclude even weak signals (=spurs) from the noise background computation. Linrad is intended to compensate for the loss of noise bandwidth but this function may be inaccurate. For the NF measurements on this page it does not matter since the same frequencies are always removed, but when measuring galactic noise on antennas where spurs come and go the correct operation of this function is essential. Likewise, the dumb noise blanker would reduce the noise floor by some fraction that should be compensated for. This is not done in Linrad-03.41 which is of no significance here since no blanker is in use for these measurements. The AFC window shows that Linrad has locked to a signal at 144.0974592 MHz. (The true frequency is 144.100 MHz.) No attempt was made to calibrate the frequency of the rtl-sdr dongle. The baseband bandwidth is about 150 Hz. This is narrow enough to make the signal free of noise. This can be seen in the S-meter graph where the white curve shows the signal level while the yellow curve shows the S/N ratio computed with the noise from the full 1.8 MHz bandwidth. During the first half of the S-meter graph (about 15 minutes) the attenuator is kept in the ice water. Note that the white curve shows that the gain is reduced by 0.1 dB when the attenuator is moved into boiling water. The S/N ratio changes from 0.019 to -1.231 which means that the Y-factor is 1.250 dB when going from 273.15 °K and 373.17 °K. NF evaluation is here. ATF33143.The S-meter graph is shown in figure 2. | |||||||||||||||||||||||||||||||||||||||||||||||||||||||
| |||||||||||||||||||||||||||||||||||||||||||||||||||||
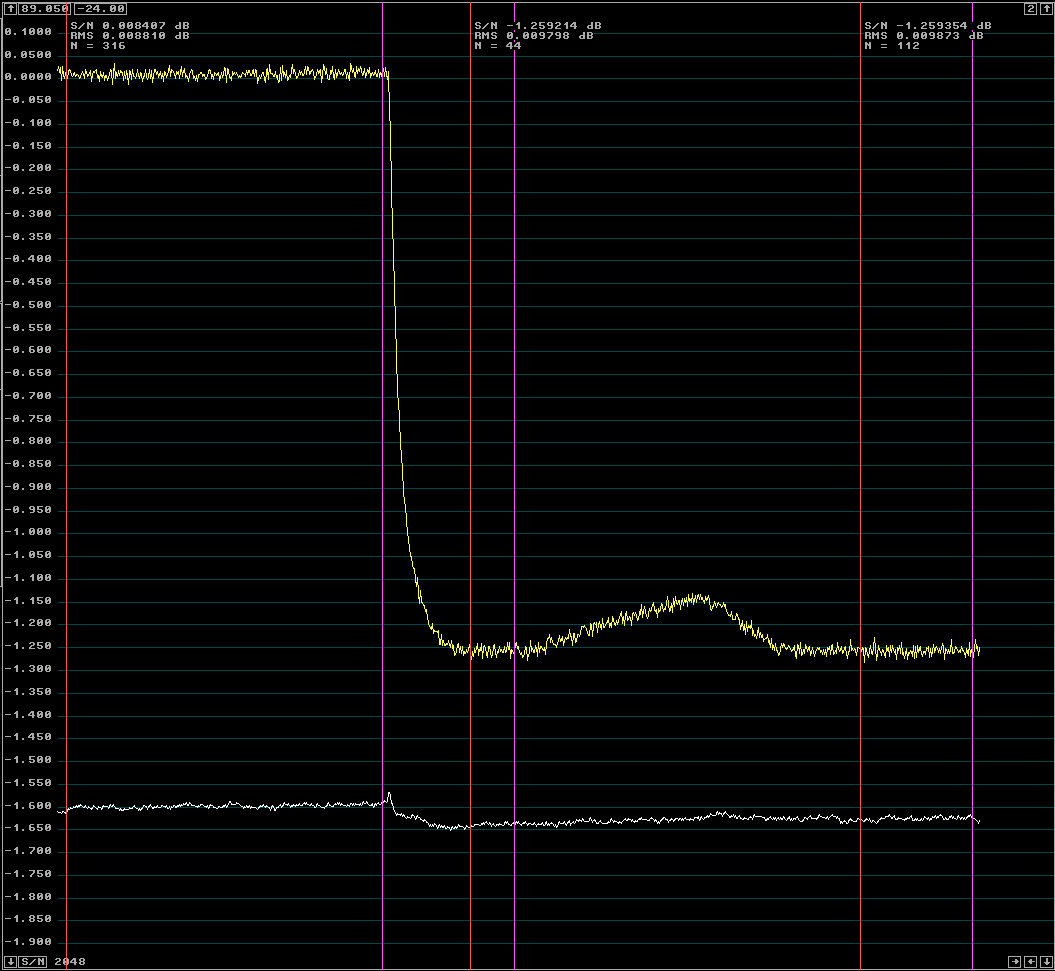
| Fig. 2. ATF33143. The Y-factor is 1.268. See text. | |||||||||||||||||||||||||||||||||||||||||||||||||||
The boiler switched off during the measurement which caused the temperature to fall. The S/N is measured at two time intervals. One before and another after the period when the water was not boiling. NF evaluation is here. MGF1425.The S-meter graph is shown in figure 3. | |||||||||||||||||||||||||||||||||||||||||||||||||
| |||||||||||||||||||||||||||||||||||||||||||||||
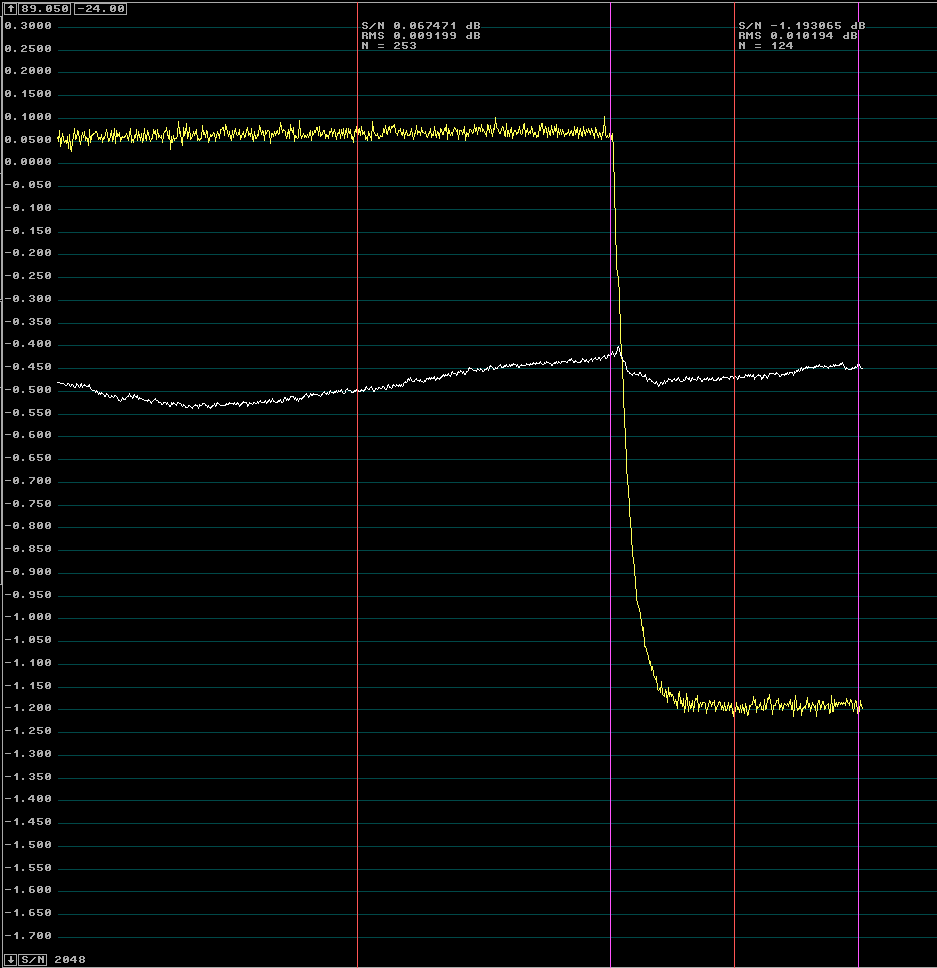
| Fig. 3. MGF1425. The Y-factor is 1.261. | |||||||||||||||||||||||||||||||||||||||||||||
NF evaluation is here. MGF1425old.The S-meter graph is shown in figure 4. | |||||||||||||||||||||||||||||||||||||||||||

| |||||||||||||||||||||||||||||||||||||||||
| Fig. 4. MGF1425old. The Y-factor is 1.173. | |||||||||||||||||||||||||||||||||||||||
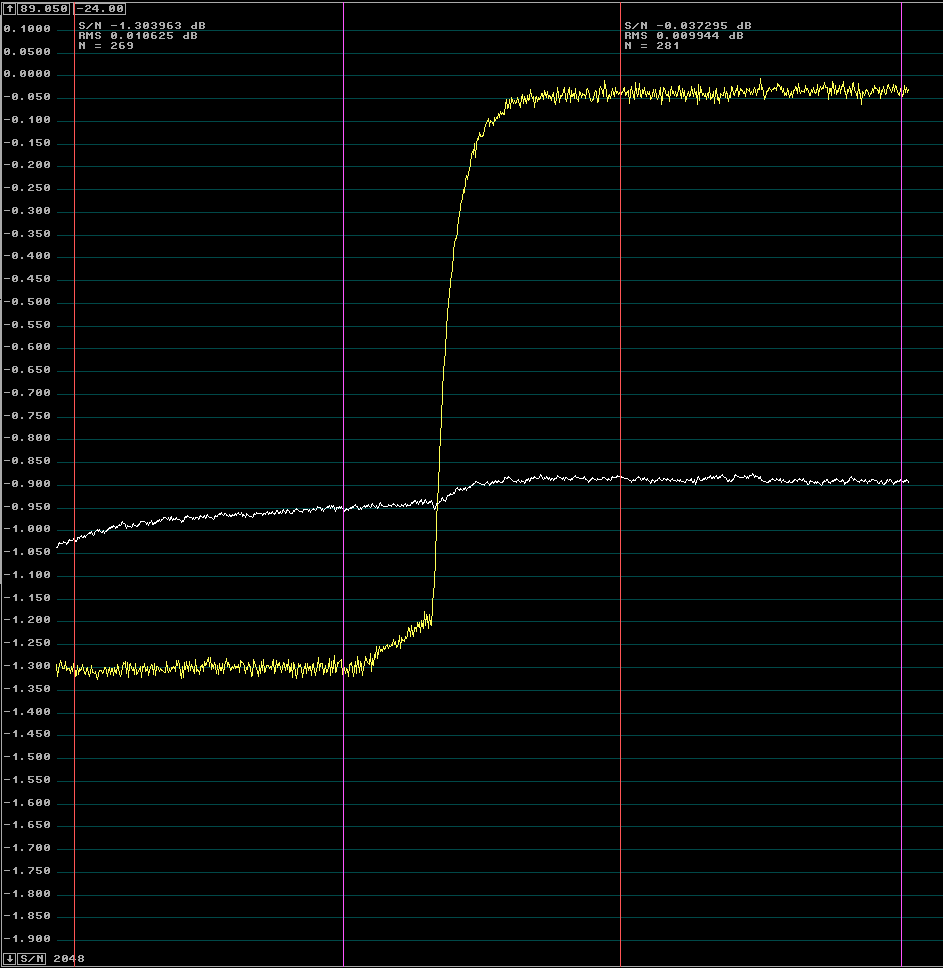
NF evaluation is here. 2xATF33143.The S-meter graph is shown in figure 5. | |||||||||||||||||||||||||||||||||||||
| |||||||||||||||||||||||||||||||||||
| Fig. 5. 2xATF33143. The Y-factor is 1.173. | |||||||||||||||||||||||||||||||||
This amplifier test starts with the attenuator in boiling water and ends in the ice-water. NF evaluation is here. ATF33143negimp.The S-meter graph is shown in figure 6. | |||||||||||||||||||||||||||||||
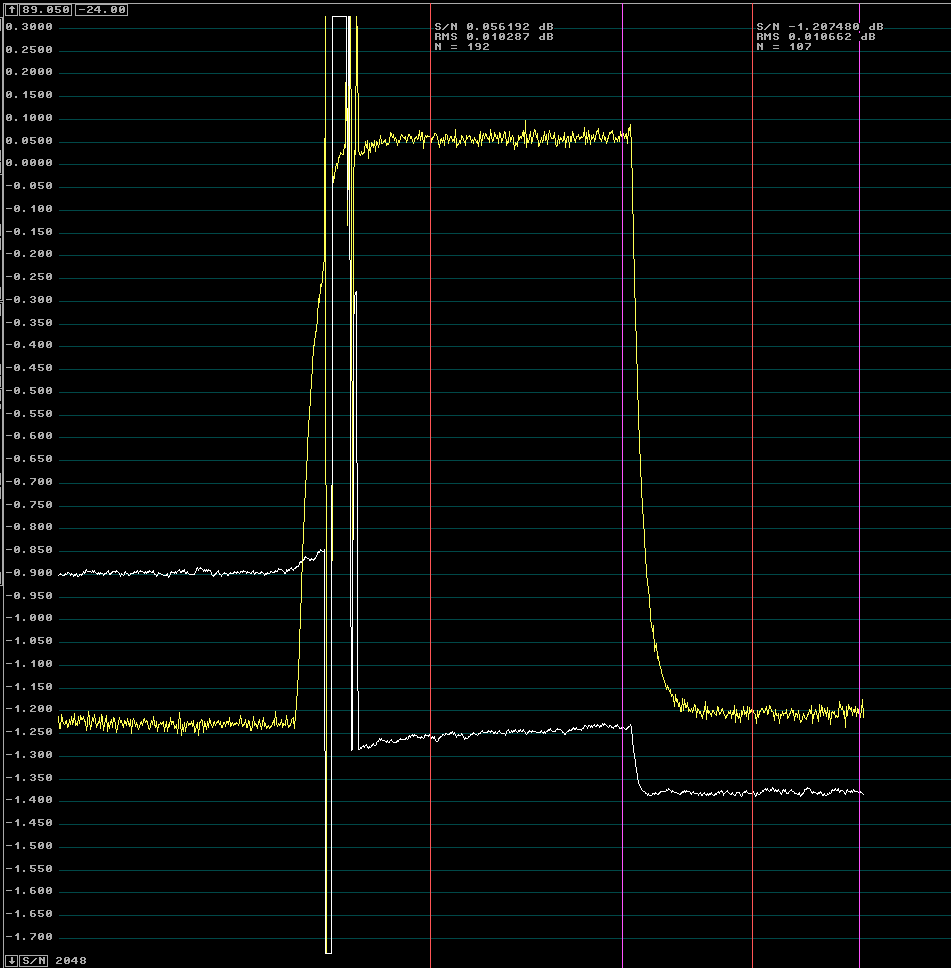
| |||||||||||||||||||||||||||||
| Fig. 6. ATF33143negimp. The Y-factor is 1.264. | |||||||||||||||||||||||||||
The gain decreases by about 0.15 dB for when the attenuator is moved from ice water to boiling water. NF evaluation is here. PSA4-5043.The S-meter graph is shown in figure 7. | |||||||||||||||||||||||||
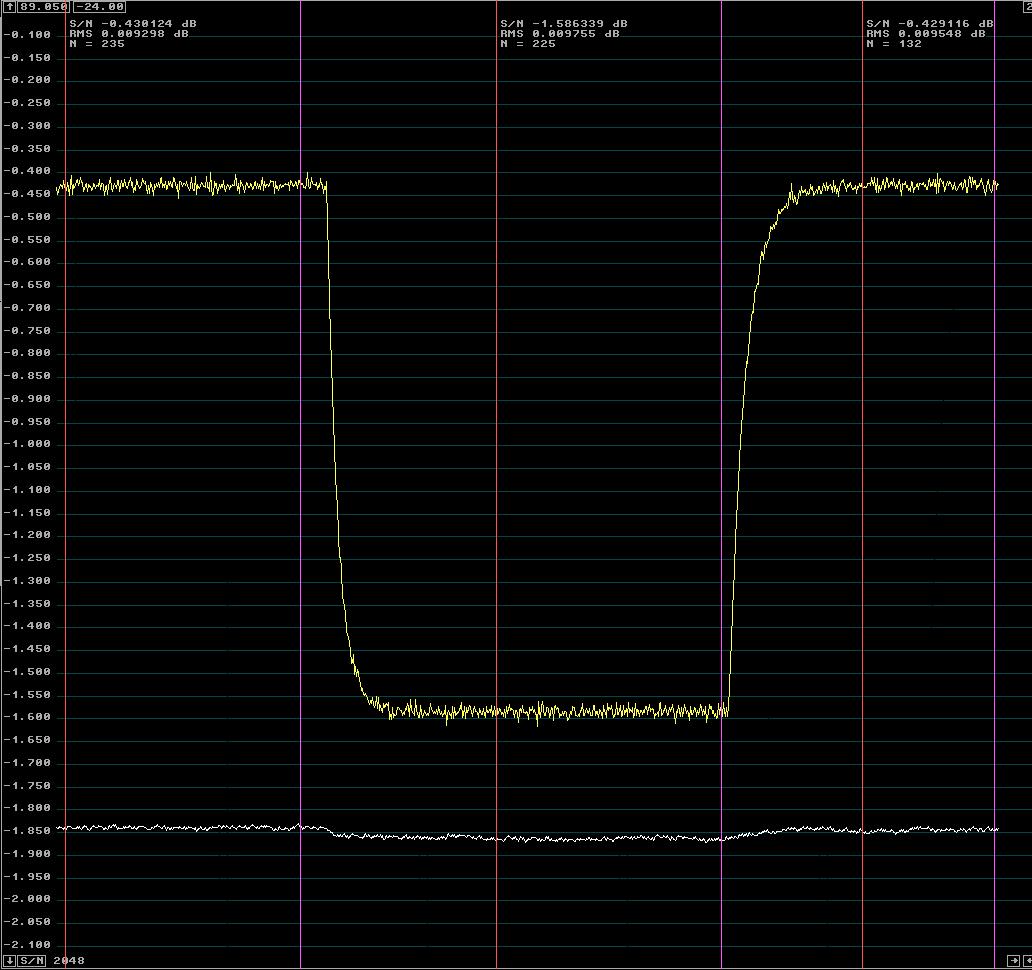
| |||||||||||||||||||||||
| Fig. 7. PSA4-5043. The Y-factor is 1.157. | |||||||||||||||||||||
The amplifier with a MMIC has a gain that does not change much with the temperature changes of the attenuator. Evaluation. | |||||||||||||||||||
   Unit        Y-factor   Y-factor  2nd NF   2nd T   Gain    Gain     2nd Tinp   TLNA    NF
  (name)         (dB)    (lin.pow)   (dB)      (K)    (dB)  (lin.pow.)   (K)     (K)     (dB)
PSA4-5043        1.157    1.30527    7.0     1163    23.7     234       5.0      49.5    0.68
MGF1425old       1.173    1.31009    9.8     2479    30.7    1175       2.1      47.3    0.66
MGF1801          1.250    1.33352    6.8     1098    27.5     562       2.0      24.7    0.35
MGF1425          1.261    1.33690    8.8     1910    30.4    1096       1.7      22.0    0.32
ATF33143         1.268    1.33906    8.2     1626    27.7     589       2.8      19.0    0.28
2xATF33143       1.267    1.33875    6.8     1098    25.8     380       2.9      19.2    0.28
ATF33143negimp   1.264    1.33783   12.5     4867    32.5    1778       2.7      20.2    0.29
Table 2.. | |||||||||||||||||
|
In table 2 the Y factors from above are collected and the second stage NF from table 1 is listed. The second stage NF is referenced to the input of the tested amplifier by conversion to a temperature that is divided by the amplifier gain. The gains are measured at 144.100 with a HP8712C. The total noise is the sum of the thermal noise of the attenuator, the noise from the tested amplifier and the noise from subsequent stages in the system 2nd Tinp. The Y-factor is the ratio of two such sums like this: Y = (373.17 + TLNA + 2nd Tinp)/(273.15 + TLNA + 2nd Tinp) The results in table 2 should rank all the amplifiers properly. There are however some systematic errors that should be taken into account. The cable from the attenuator to the test object is 120 mm of Suhner 02250 high temperature teflon cable (as measured from the water surface.) The nominal loss is 0.33 dB/m at 150 MHz so this cable would add 0.04 dB to the NF result if it were kept at room temperature over all the 120 mms of its length. It seems reasonable to assume it adds 0.02 dB to the result. In this experiment, a second cable, 130 mm of RG223U was also inserted. The nominal attenuation is 0.16 dB/m so this cable contributes 0.02 dB. The correction for cable losses should be about -0.04 dB. The attenuator is made with standard surface mount resistors. The attenuation varies with temperature. Figure 8 shows the change with temperature. | |||||||||||||||
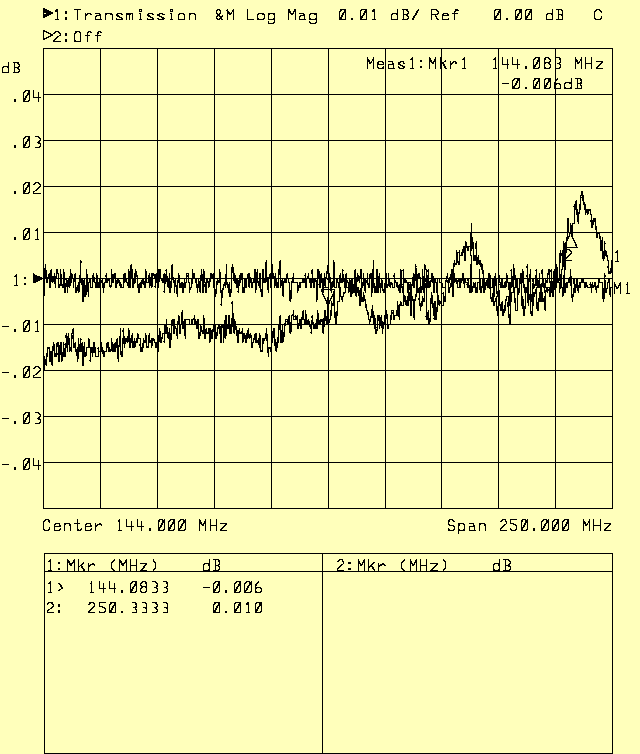
| |||||||||||||
| Fig. 8. Attenuation vs temperature. The instrument is calibrated to show zero transmission loss with the attenuator at 0 ° C. The transmission loss changes by something in the order of 0.01 dB when the attenuator is heated to 100 ° C. | |||||||||||
It is not obvious how to correct the NF results by use of the data from figure 8. There is obviously some uncertainty here. Table 3 shows the final result of this study. It has cable losses included. | |||||||||
   Unit           NF
  (name)         (dB)
PSA4-5043        0.64
MGF1425old       0.62
MGF1801          0.31
MGF1425          0.28
ATF33143         0.24
2xATF33143       0.24
ATF33143negimp   0.25
Table 3. Final results for the study on this page.. | |||||||
|
The amplifiers on this page were brought to the 15th INTERNATIONAL EME CONFERENCE and measured there in several ways. This link results from EME 2012. shows the raw data as well as the conclusions I think one can draw from a comparison with the data in table 3. (Table 3 was published before the meeting.) Impedance variations.Figure 9 shows the impedance change between 0 and 100 °C. The change is 0.7 ohms. | |||||

| |||
| Fig. 9. Impedance vs temperature. The instrument is calibrated to show 50 ohms with the attenuator at 0 ° C. The impedance change at 144 MHz is 0.7 ohms. | |
An impedance change of 1.4% may cause a gain change of 0.15 dB. That is a factor of 1.035 in power and it could cause the Y-factor to grow from 1.33906 to 1.3859 for the ATF33143 in a conventional measurement where noise powers and not S/N were measured. An evaluation would then give NF=-0.24. |