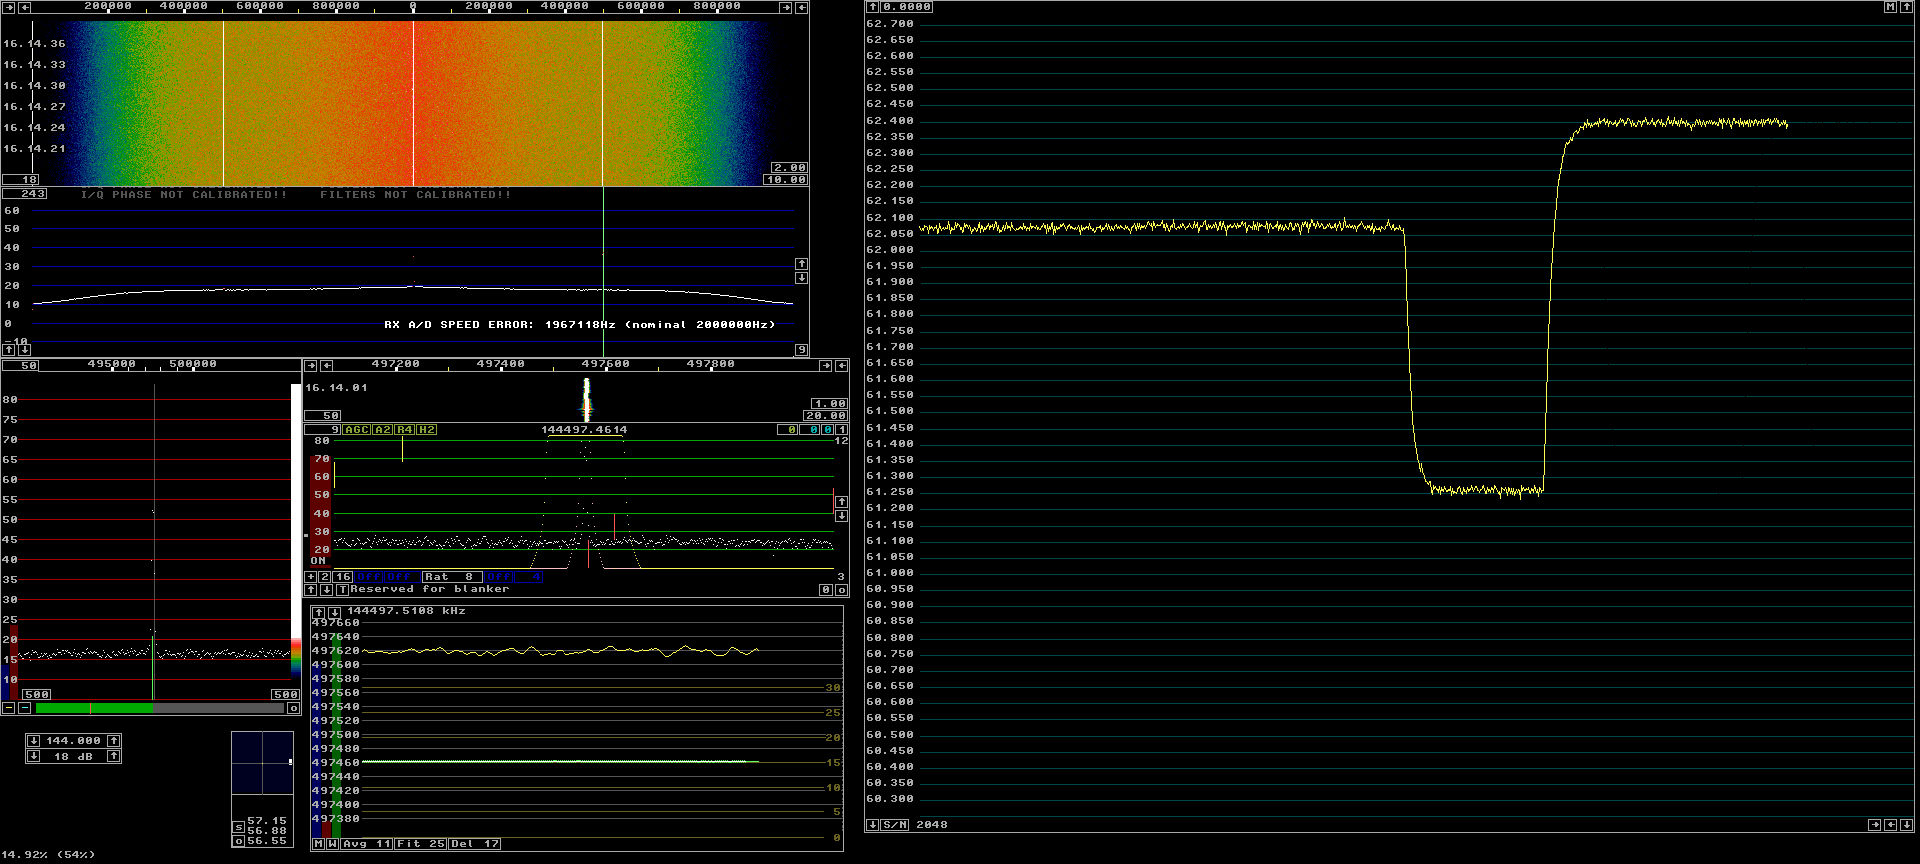
Figure 1 shows such an experiment with an amplifier built with the PSA4-5043 MMIC from Minicircuits. The amplifier is operated on 144 MHz using a RTL-SDR USB dongle as the receiver.

| |||||||||||
| Fig. 1. Linrad running in S/N mode. The AFC keeps the signal centered in the baseband. The three different levels are caused by different temperatures in the signal source. | |||||||||
The S-meter graph has three regions. First the 40 dB attenuator between a HP 8657A signal generator is kept at room temperature. The arbitrary dB scale shows a value of about 62.75 dB. Then the attenuator is placed in boiling water which of course increases the noise and reduces S/N. It becomes about 61.26 dB. Finally the attenuator is placed in an Ice/water mixture which causes S/N to become about 62.40 dB. By use of a couple of thermometers the following results of table 1 were found. | |||||||
 Case            Mercury     Electronic(1)    Electronic(2)
Room temp       26.2 °C       25.4 °C          26.3 °C
Boiling water   99.0 °C      100.0 °C          99.8 °C
Ice/water        0.0 °C        0.6 °C           0.0 °C
Table 1. Temperatures for figure 1 using different thermometers. | |||||
|
The air pressure was between 997 and 1002 hPa according to Swedish weather sites. Taking altitude into account the air pressure was probably 999 hPa during the experiment. Pure water would then boil at about 99.6 °C. The water contains about 0.15 grams of dissolved salts per liter and I think one can say that the boiling and ice/water temperatures were 99.7 °C and -0.1 °C with an uncertainty of 0.2 °C. With destilled water this uncertainty should be smaller. The room temperature as the average of three thermometers was 26.0 °C with an uncertainty that might be 0.5 °C By use of an image editor one can evaluate the S-meter graph. The result is shown in table 2. | |||
 Temp.     Y-pos     Y-pos     Y-pos
 (°C)      (pixels)   (dB)    (power)
  -0.1      123        0       1.0000
 26.0       227      0.322     1.0770
 99.7       491      1.139     1.3000
Table 1. Evaluation of dB values from the S-meter readings of figure 1. 1 dB is 323 pixels and 0 dB arbitrarily chosen as the reading at -0.1 °C. The uncertainties in the Y positions are less than 1 pixel, (0.003 dB) | |
|
The error in the Y-factor is the difference between two numbers and the error can be estimated to be ± 0.006 dB. The corresponding error in the linear power ratio is ± 0.002 Assuming that the attenuation does not change with the temperature, and neglecting the influence of the cable between the attenuator and the amplifier under test one arrives at the following numbers: (273.16 + 99.7 ± 0.2 + X) / (273.16 - 0.1 ± 0.2 + X) = 1.1390 ± 0.002 Combining uncertainties we get two equations and the true noise temperature X should be somewhere between the results from solving them. (372.66 + X) / (273.26 + X) = 1.302 .... (1) (373.06 + X) / (272.86 + X) = 1.298 .... (2) The solution of (1) is X=55.88 while (2) gives X=63.38 which means that the result is 59.6 ± 3.8 for the noise temperature in degrees Kelvin. The RTL-SDR dongle is screened with a well arranged USB connection having DC minus and GND in the chassis and a decoupled +5V line. The NF at the RTL-SDR input is 7 dB corresponding to a noise temperature of 1189 K. The gain of the tested Minicircuit MMIC amplifier is 23.5 dB. 224 times in power so the noise from the RTL-SDR contributes 1189/224=5.3 degrees when referenced to the input of the tested amplifier. When taking this into account we find that the noise temperature of the tested amplifier itself is 54.3 ± 3.8 K. This would be the true noise temperature of the tested amplifier under the assumption that the attenuator is temperature independent and that the cable losses are zero. The corresponding NF would be 0.75 dB ± 0.05 dB There may however be other errors that have not been included in the error estimation. The cable from the attenuator to the test object is 120 mm of Suhner 02250 high temperature teflon cable (as measured from the water surface.) The nominal loss is 0.33 dB/m at 150 MHz so this cable would add 0.04 dB to the NF result if it were kept at room temperature over all the 120 mms of its length. It seems reasonable to assume it adds 0.03 dB to the result. In this experiment, a second cable, 130 mm of RG223U was also inserted. The nominal attenuation is 0.16 dB/m so this cable contributes 0.02 dB. Taking cable losses into account gives a final NF result of 0.69 ± 0.1 dB. To this comes the uncertainty due to the possible temperature dependence of the attenuator. This page was corrected Nov 19 2012. The error estimate, 2 pixels on the Y-factor was not 0.002 as it should have been, but 0.0001 dB due to a typing error(?). That resulted in a far too small error limit. Operated at 5V this chip should provide a NF around 0.71 dB according to the data sheet from Minicircuits. There will be a meeting in Cambridge where amplifier noise figures will be measured. I will bring the PSA4-5043 MMIC amplifier to the meeting and present the results on this page afterwards. Look here for the results from EME2012 |