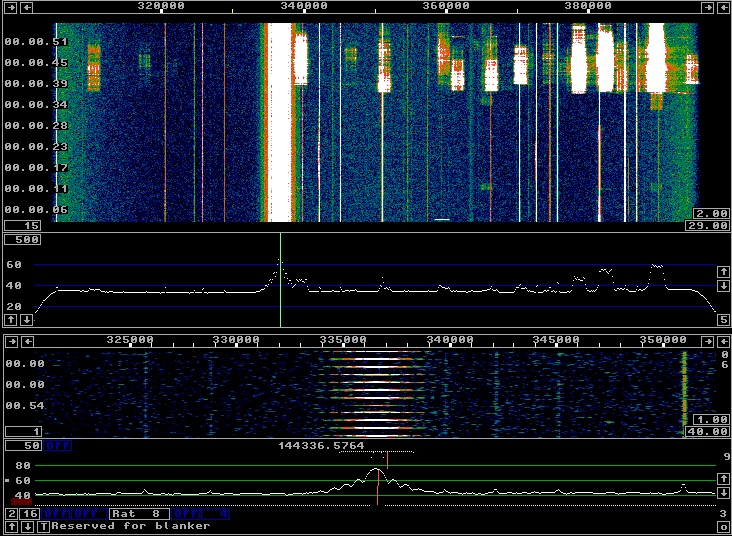
The recording.This file http://sm5bsz.com/linuxdsp/usage/radar/pers2008/r1111.wav (20799912 bytes) was recorded with the WSE rx and tx converters and a Delta 44 on a Pentium IV as a Linrad .raw file at 11.11 local time on Aug 12 2008 with Linrad transmitting short dots in CW mode. At this time the radar mode was far from completed and the dots were generated by an audio function generator.With Linrad-02.52 the radar mode can read data from a file and display averaged waterfall graphs on the screen, but only with the second fft de-selected. I.e. without any noise blanker. The recording can be used to evaluate the timing of the transmit/receive switching as well as the transmitted bandwidth and other aspects of the hardware performance whhic is the main objective of this page. With later versions of Linrad the radar mode will also be available in real time and this page also shows the effects of selecting different parameters for the radar mode. Besides the WSE converters, amplifiers producing 1kW of RF power and a 1wl 6 element yagi with 9dBd gain was used. The antenna was about 2 meters above ground only. The power amplifiers as well as the PIN diode switch were operated with the control signals described here The pilot tone in the Linrad Tx and here Tx control in SDR systems. Figure 1 shows the Linrad screen when processing the file in weak signal CW mode. The control voltage for the PIN diode switch is not only used to switch the antenna between the RX preamplifier and the TX power amplifier. A second (low level) switch is used at the RX144 input to switch between the preamplifier output and the transmit signal as obtained from a directional coupler on the power amplifier output through an attenuator. As can be seen in the figures 1 to 3 the transmitted bandwidth is about 3 kHz, compatible with normal bandwidths in SSB mode. The transmitted pulse has a rise time of 1 millisecond, the shortest rise time allowed in Linrad. |

|
|
Fig 1.The entire file r1111.wav displayed with
Linrad in mode A=Weak signal CW.
|
|
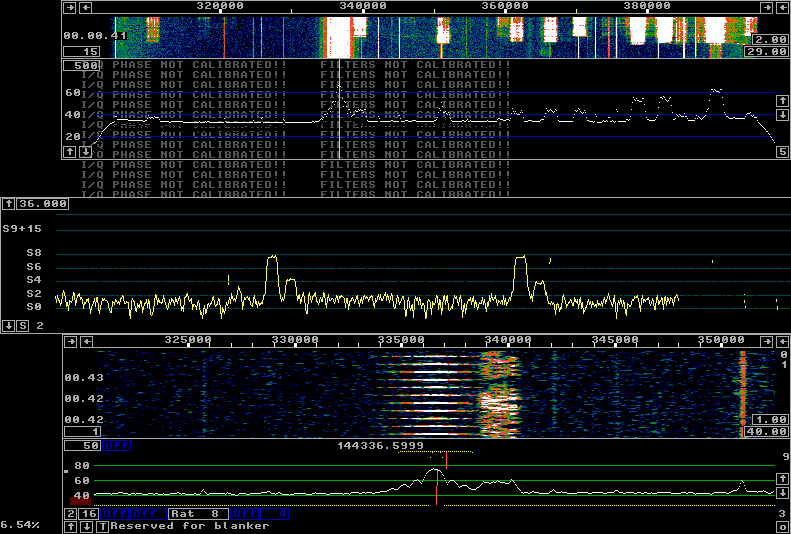
The most obvious feature in figure 1 is a burst of about 10 seconds duration about 37 seconds into the file. This burst gives a strong echo that would easily be heard in the loudspeaker/headphones when operating in CW mode with the loudspeaker muted during transmit or with just a weak side-tone. A strong burst like this one should be audible even in SSB mode as a reflection of the own transmitted signal, provided that the muting is set aggressive enough to switch to RX mode between syllables. Would have been very useful for meteor scatter in the past before digital modes became dominating. Figure 2 shows a screen dump taken 43 seconds into the file, about 5 seconds into the burst. Here one can see that the reflected signal is about 20 dB above the noise floor in a bandwidth of 3.5kHz. |

|
|
Fig 2.About 5 seconds into the burst.
|
|
From figure 2 one might be led to believe that the signal level reflected from a meteor trail is constant with time. On small meteor trails one should expect fading however and that can be seen from figure 3 which shows the S-meter graph at approximately the same time at a four times compressed time scale which shows the echo from 11 sucessive pulses. |

|
|
Fig 3.The S-meter about 5 seconds into the burst.
|
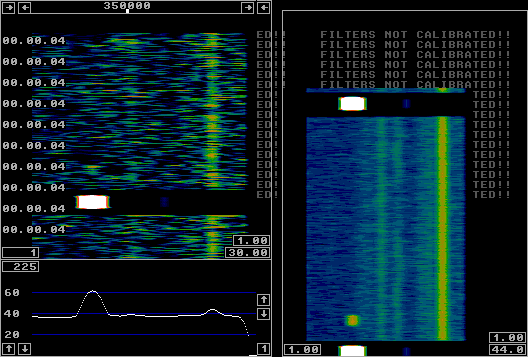
Linrad in Radar ModeThe most valuable application of a VHF radar in amateur radio is probably the Aurora monitor. The direction, distance and amplitude of the echoes gives information in real time about which propagation paths are currently open. This way one can call CQ into directions where nothing is heard, knowing that a DX station will be able to hear the signal provided he has a suitable antenna direction. The radar mode of Linrad allows evaluation of the doppler shift but whether the information might be useful is unknown to me at the present time.A radar is presumably even more useful on 6 meters, but the distances of interest would be longer so timing would be less critical. Whether a radar could be useful to radio amateurs on HF bands is totally unknown to me, but the radar mode of Linrad is flexible and should be useful for performing tests. Figure 4 shows the first echo, a short ping, four seconds into the recording. The settings are extreme, with a FFT bandwidth of 6kHz and a window function sine to power 9. The size of this FFT is 64 only and since the total spectrum is 96 kHz, the fft bins are separated by 1.5 kHz with four bins over the FFT bandwidth. This is a reflection of the extreme window that has a large amplitude over only about 25% of the time span of one transform. The transforms overlap by 75% which means that a new transform is computed every time 16 new samples have arrived. The transforms are thus computed at a rate of 96kHz/16 with a time between each line in the waterfalls of 0.1666 milliseconds. |

|
|
Fig 4. 0.166 ms between waterfall lines.
|
|
The left side of figure 4 shows the normal main window of Linrad with a main spectrum and a waterfall graph. The right side shows an averaged waterfall with a time constant of 1 second. The averaging is synchronous with the transmit pulse and the time is long enough to show the next transmitted pulse. From the figure one can see that the repetition time for the transmitted pulse was 249 pixels corresponding to 41.5 ms which means that the pulse repetition frequency is 24 Hz. The pulse length is 10 pixels, 1.6 ms, and the dead time from full tx power to full RX sensitivity is 7 pixels or about 1.2 ms. The meteor echo is 33 pixels, 5.5 ms delayed with respect to the transmitted pulse which with the speed of light corresponds to 1650 km. This means that the distance to the meteor trail was 825 km. The frequency scale in the main window of figure 4 is expanded four times with 16 pixels over the bandwdth while the averaged waterfall is expanded three times only. Drawing the main waterfall at a rate of 6000 lines per second causes very high CPU load for no good reason in real usage of the radar mode. It is done on this page only to help understanding what the radar mode is doing. Figure 5 shows the same echo with normal parameters optimised for time resolution. Here the window function is set to sine squared with a bandwidth of 3 kHz and an fft size of 64. The transforms in figure 5 overlap by 50% and they arrive at a rate of 3 kHz. |

|
|
Fig 5. 0.333 ms between waterfall lines.
|
|
Figure 5 shows the same thing as figure 4 but S/N is a little better because of the narrower bandwidth. The CPU load is 50% smaller. Figure 6 is optimised for sensitivity and frequency resolution. Here the bandwidth is 750 Hz only with a sine to power 2 window. |

|
|
Fig 6. 1.333 ms between waterfall lines.
|
|
The FFT size in figure 6 is 256. The horizontal scale is one pixel per FFT bin in both the main window and the averaged waterfall. The averaged waterfall is expanded in the time scale by a factor of 6 simply by drawing six identical horizontal lines for each transform. Sensitivity and frequency resolution is much better, but the time resolution is no longer good enough to see echoes at a shorter distance than about 500 km. The meteor trail shows a doppler shift of about 1 pixel, 375 Hz, towards higher frequencies. |

|
|
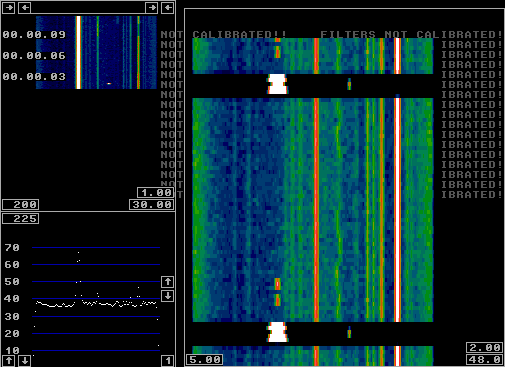
Fig 7.The first and the second ping in the
r1111.wav file.
|
|
Figure 7 shows the first and the second ping in the r1111.wav file. Here normal settings for a 144 MHz radar is used. The fft1 bandwidth is 1.5 kHz with a sine squared window function and a FFT size of 128. The main waterfall is normal, with an average over 200 transforms for each waterfall line. The second meteor trail is at a distance of about 1200 km, close to the maximum range in meteor scatter. The time constant of the averaged waterfall is 5 seconds to allow the echo of the first ping to survive until the second one occurs. A shorter averaging would improve S/N because the duration of these pings is far below 5 seconds. To SM 5 BSZ Main Page |