The graphs on this page were produced with second fft disabled.
They are intended to bring attention to the influence of
window functions and resampling ratios on dynamic range.
When second fft is enabled the point reduction is very much
simpler because the selective limiter assures there are no strong
signals present.
The second fft has its own problems as illustrated here
Setting up the first fft
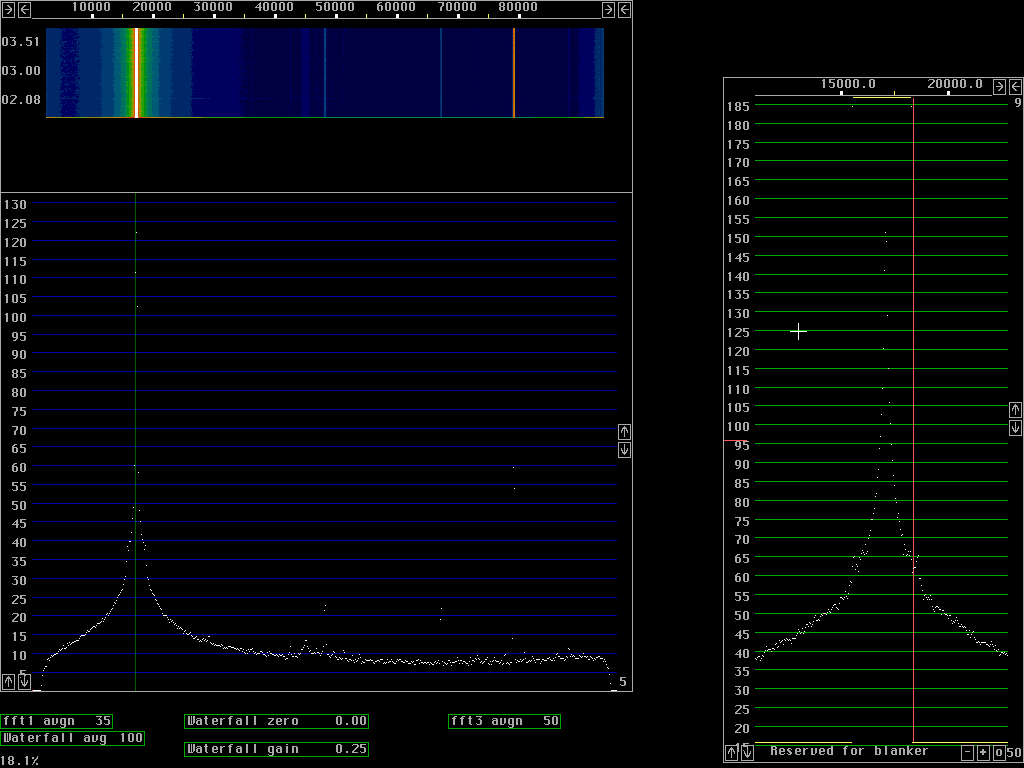
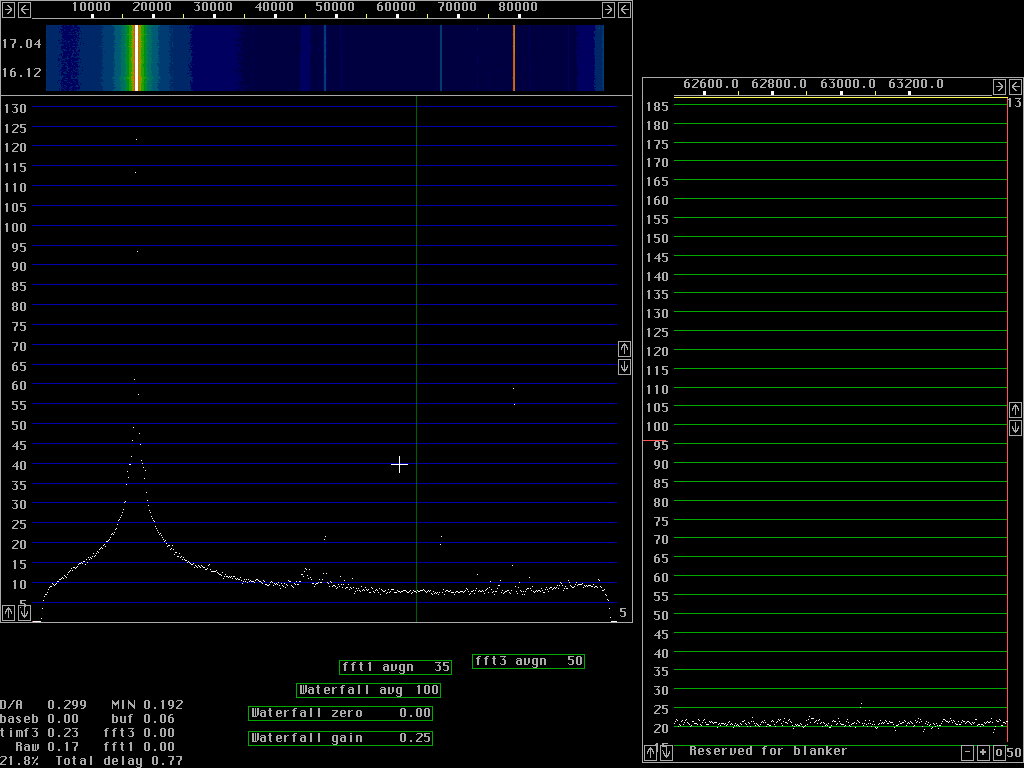
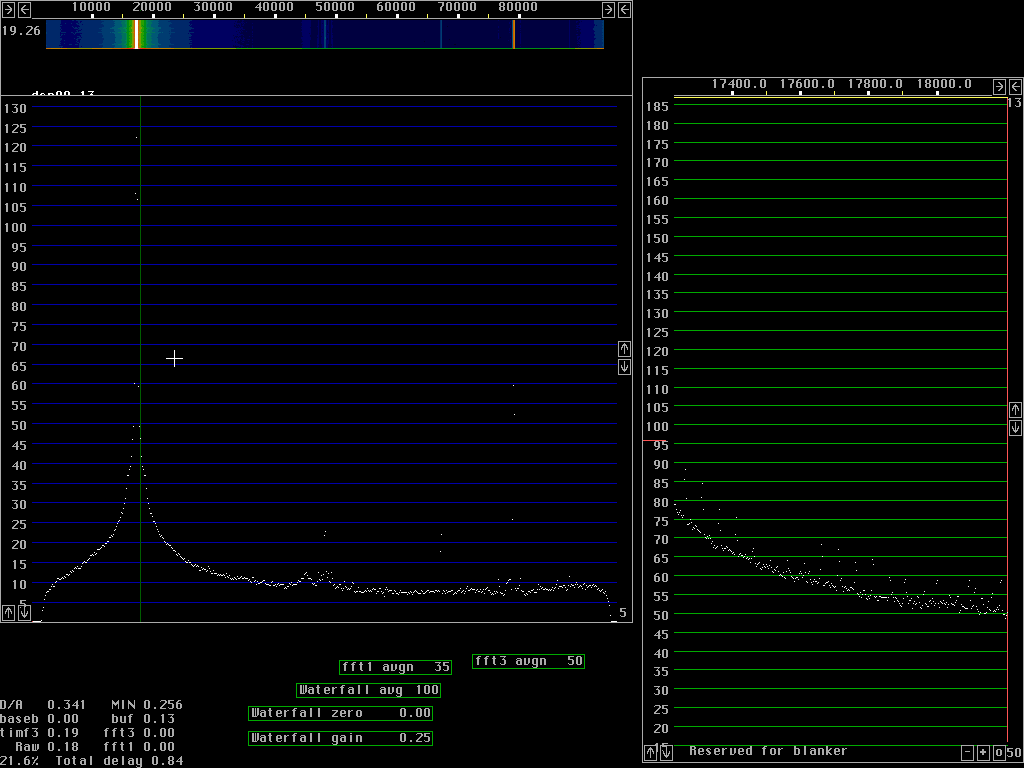
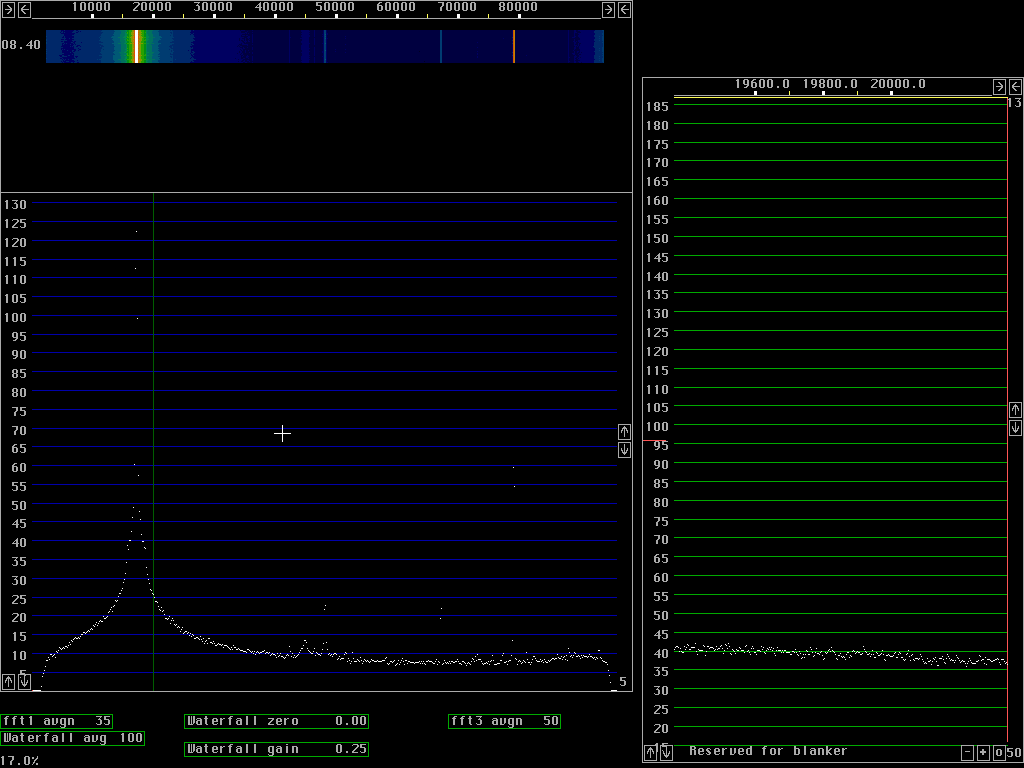
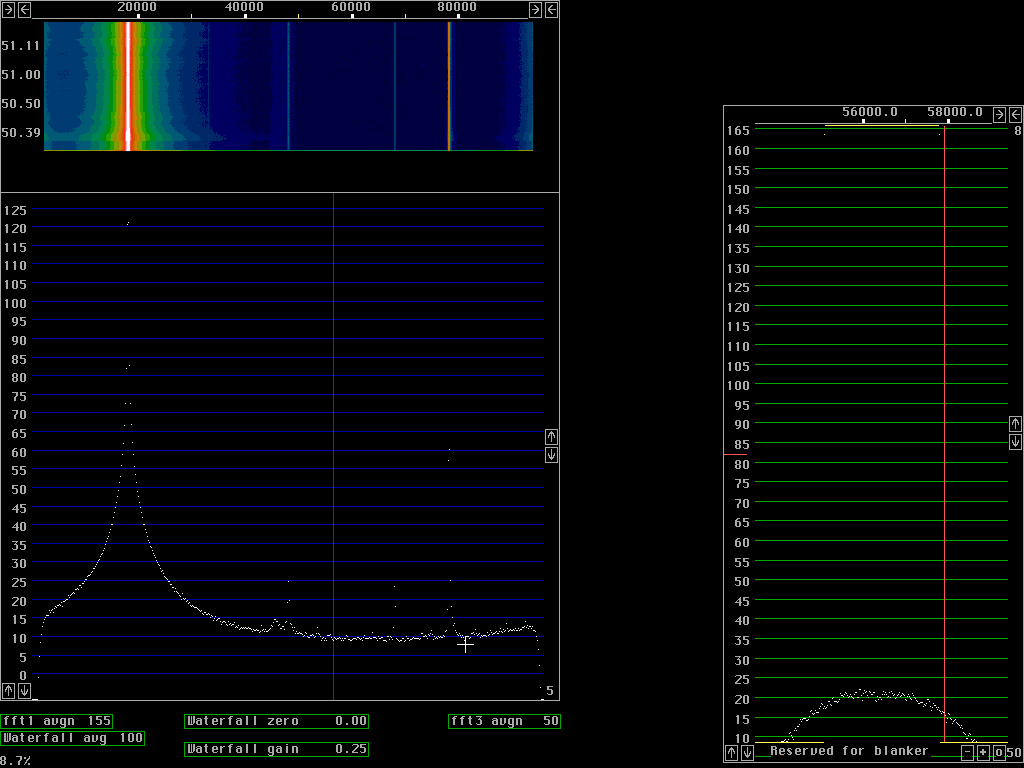
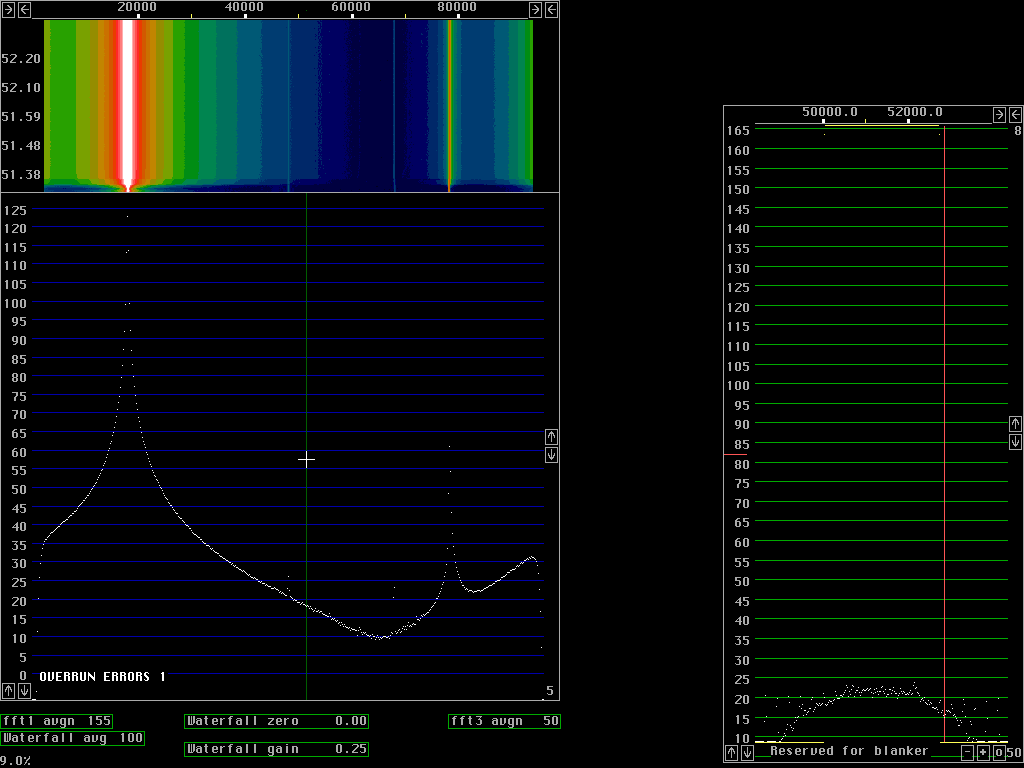
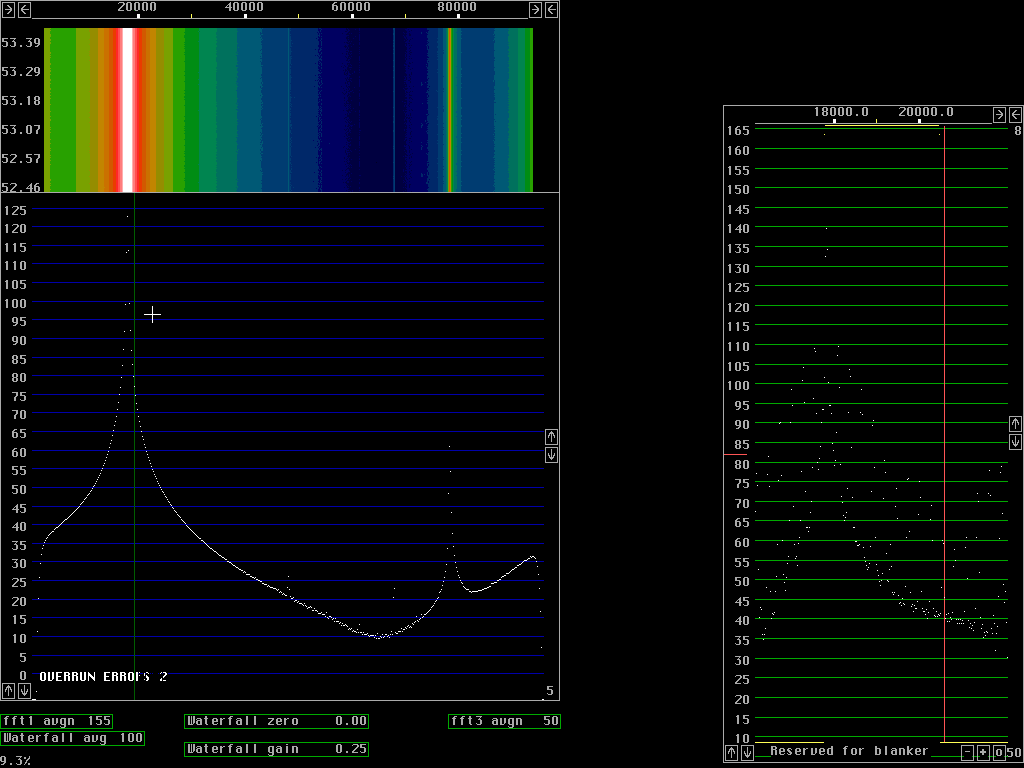
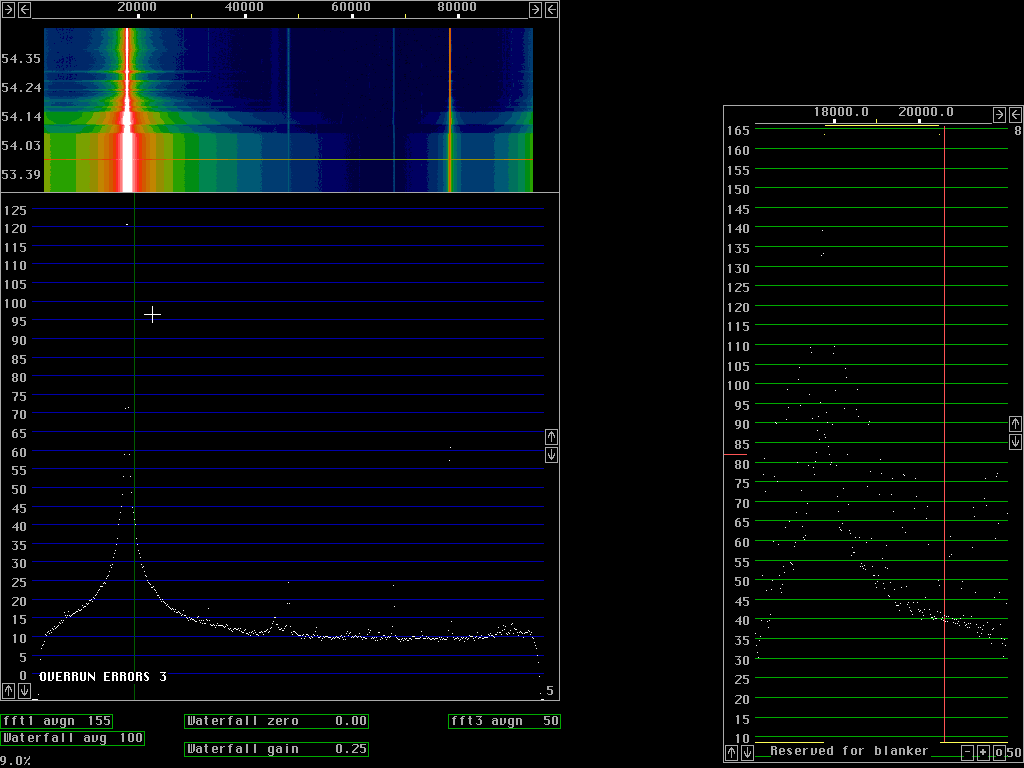
Fast processing with poor dynamic rangeFig. 1 to fig. 4 are produced with size 512 fft for 96 kHz bandwidth. The window used is a sine curve (sine to power 1) and it does not attenuate wery much near the ends of each transform. As a consequence a sine wave becomes fairly broad in case the frequency happens to be right between two fft bins as in fig. 2 and 3. If the frequency is close to a frequency bin the signal will continue from the point n-1 to point 0 (which is the same as point n) without any phase discontinuity and then the spectrum becomes very narrow as in fig.1 and in particular fig.4.The time functions corresponding to two sucessive transforms overlap at about the -6dB point of the window function. With a low power of sine the overlap is small so fewer transforms have to be calculated. If all points are included, the back transform becomes identical to the original A/D data but when a subset of the points is used, for figures 1 to 4 only 1/16 of the points are used. These back transforms are in 32 points only. The 32 points span a frequency range of 6kHz symmetrically around the green line in each figure. In fig. 1 the green line is placed outside the signal where the noise floor dominates some 110dB below the strong signal. The 6kHz wide signal that comes out from the back transforms is again fourier transformed, this time with size 256 transforms and the result is the baseband graph at the right side of figures 1 to 4. From fig. 1 we locate the noise floor at 21 dB in the scale of the baseband graph. Fig.4 is centered near the signal and shows the signal to be at 139dB, 121dB above the noise floor, taking the sin squared window into account. This is at a bandwidth of about 40Hz, that is why the dynamic range is about 10dB better compared to the main spectrum at about 10 times larger bandwidth. Fig. 2 shows that discontinuity spurs start to degrade the dynamic range more than 30kHz away from the strong signal in case the signal is right between two frequency bins. Some signal energy actually belonging to the signal is present in the frequency bins 30kHz away. They form spurs that are strongest at the edges of the baseband but already this far away they reach the noise floor in the center region. Note that the noise floor in the baseband is attenuated at the sides with a sine squared window, the spurs are really strong at the sides. Close to the signal, as shown in fig. 3 the spurs are only 70 dB below the strong signal. In the near frequency range the spurs are generated by a different mechanism which can be seen by a comparison between fig. 3 and 4. The strong spurs are because the picking out of only 32 points leaves some of the major signal components inside the passband and some other outside. The sine squared window that one can see in the noise floor of the baseband graph reduces this problem but the curvature of the sine squared filter in 32 points only is far too sharp for such a wide signal as the one obtained with a sine window in 512 points.
|
In figures 5 and 6 the baseband uses 512 point transforms so each bin is 47Hz. The figures show the noise floor 130dB below the signal and the signal is about 2.5kHz wide at the -90 dB points. From these figures one can not say much about the origin of the skirts on the signal.
Figures 7 and 8 shows the noise close to the strong signal at higher resolution. These fft's are in 8192 points with 2.9Hz for each bin. The signal generators used for this experiment are not good enough to really evaluate the spurs from the mixing and resampling process.
For practical use parameters somewhere between the two examples on this page will be adequate. At the present time it is to early to give recommendations for specific hardware combinations.
