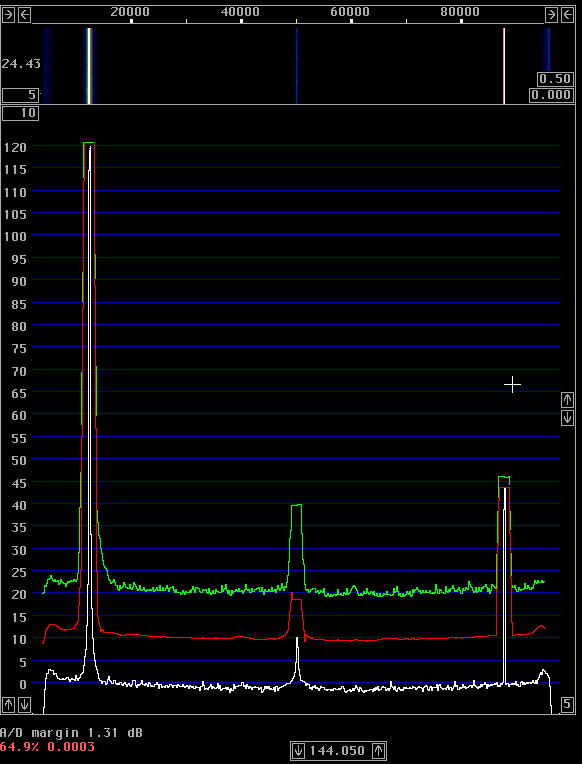
Fig. 1. Linrad and WSE converters in "Tx test mode" with a good crystal oscillator used as the transmitter under test.
Setup to measure transmitter spectral purityThese measurements were made with Linrad running on a PentiumIV 2.66GHz computer with a modified Delta44 soundcard. The RF signals were converted to audio by use of the WSE converters RX144 or RXHFA, RX70, RX10700 and RX2500.The measurement system has much better dynamic range than required for these measurements so no corrections have to be made for the noise contribution from the measurement system. The unit under test was connected to a 20dB 100W attenuator followed by an ordinary step attenuator which was connected to the RXHFA or RX144 unit. The step attenuator was adjusted to place the signal approximately 1.5 dB below A/D saturation. The transmitter frequency was set to about 14.125 or 144.125 MHz and Linrad was run in the "tx test mode". Linrad was also run in normal receive mode in which time domain graphs are available with the F4 key. The screen of Linrad in tx test mode looks like figure 1 in which a good crystal oscillator is fed into the system. There are three spectra shown simultaneously. The red line is the average spectrum in a bandwidth of 2.4 kHz. Note that the noise floor is about 110 dB below the carrier. 10log(2400)=34 so this means that the noise floor is at about -144 dBc/Hz. |

Fig. 1. Linrad and WSE converters in "Tx test mode" with a good crystal oscillator used as the transmitter under test. |
|
The white line is the average spectrum just as it would be displayed in normal operation of Linrad. Here one can see narrowband spurs. In figure 1 the white curve is about 11 dB below the red curve which means that the bandwidth is about 200 Hz in this particular measurement. The green curve is the peak power in 2.4 kHz bandwidth. For white noise, the peak to average ratio is about 11.5 dB. For a pure carrier, the peak power is equal to the average power. Note that the zero frequency spur has a much higher peak to average power ratio than 10 dB, it is the 1/f noise of the Delta44 soundcard that produces a narrowband signal with an 1/f modulation on it. The mirror image spur has a peak to average ratio of about 2 dB. This is because the image suppression depends on the phase with respect to the sampling clock. The way the mirror image is suppressed in Linrad limits the suppression to about 70 dB because of this phenomenon. Continous carrierThe raw data is available here: TS-2000 carrier spectraThe spectral purity of a continuous carrier is listed in table 1. In this table spurious signals are excluded. To see the spurs, look at the spectra. |
 Band        Noise floor in -dBc/Hz
             5kHz  10kHz  15kHz 20kHz  30kHz 40kHz 50kHz
144 MHz     104.7  112.9  117.2 120.6  124.5 127.5 129.7
 14 MHz     110.3  118.3  121.5 123.0  124.5 125.2 125.4
Table 1. Noise floor at different frequency separations
from a continuous carrier from a TS-2000.
The serial number is 50500050.
|
Spectral purity and time domain waveforms of keyed CW transmissions.The TS-2000 was tested during normal morse code transmissions with the same setup as for continuous carrier. To see the spectra, click on the links below:TS2000 at full power (100W) on 144 MHz TS2000 at full power (100W) on 14 MHz TS2000 at reduced power (25W nominal) on 14 MHz The TS-2000 does not suffer from keying clicks at full power and at reduced power the ALC induced keying clicks are weak and only present close to the carrier. The spectral purity listed under continuous carrier is representative for the performance of the keyed transmitter also. The peak power measurements in 2.4 kHz bandwidth are listed in table 2. |
 Band and power             Splatter level below PEP at
                      5kHz 10kHz 15kHz 20kHz 30kHz 40kHz 50kHz
144 MHz, 100W          61   70    74    77    82    85    87
14 MHz, 100W           57   75    78    80    80    80    80
14 MHz, 25W            57   75    78    79    80    80    80
Table 3. Splatter (peak power in 2.4 kHz bandwidth) at different
frequency separations from SSB voice transmissions.
|
Spectral purity of voice SSB transmissions.The TS-2000 was tested by monitoring the spectrum the same way as was done for CW transmissions while the owner was talking into the microphone.TS-2000 144MHz 100W SSB TS-2000 144MHz 25W SSB TS-2000 14MHz 100W SSB TS-2000 14MHz 25W SSB The peak power in 2.4 kHz bandwidth in CW mode at different frequency separations. |
 Band and power             Splatter level below PEP at
                      5kHz 10kHz 15kHz 20kHz 30kHz 40kHz 50kHz
144 MHz, 100W          32   48    55    61    71    86    89
144 MHz, 25W           35   48    64    79    84    86    89
14 MHz, 100W           32   53    59    68    77    78    78
14 MHz, 25W            32   49    61    69    79    79    79
Table 3. Splatter (peak power in 2.4 kHz bandwidth) at different
frequency separations from SSB voice transmissions.
|
|
It seems like the peak level out from the SSB filter is a little higher in SSB mode compared to CW mode and that the ALC produces some splatter in SSB because of the higher gain reduction needed. No time domain waveforms were recorded in SSB mode so there is no solid evidence for this hypothesis. To SM 5 BSZ Main Page |