|
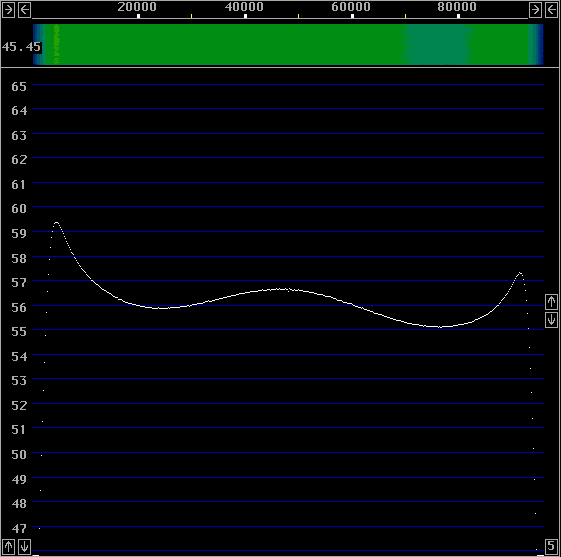
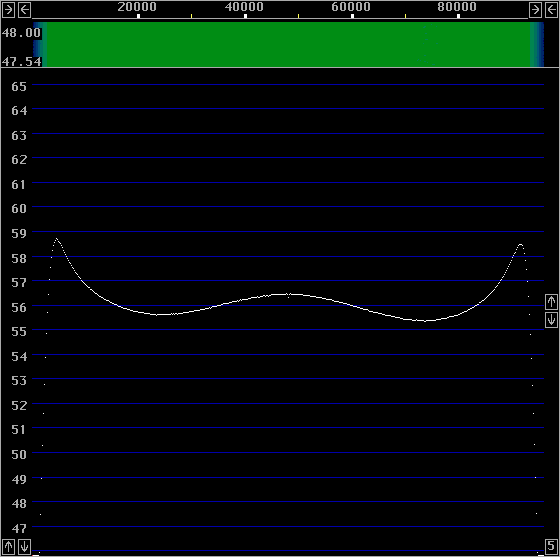
Fine tune C99, C104 and C105 for a symmetric spectrum
with as much amplitude as possible.
A typical result is shown in fig.2.
|

|
The frequency response is not very important.
The Linrad calibration procedure corrects for all
filter errors and the only consequenses of a non-flat
frequency response is changed dynamic range properties.
As the unit is designed now, gain increases slightly at high audio frequencies. This is to partly compensate for the higher noise floor of the Delta44 at high audio frequencies. One could also allow the amplitude to fall by up to 10 dB towards the spectrum ends to improve the tolerance for undesired signals but then the system noise figure would be degraded for higher audio frequencies. The frequency response is easy to change, but at the present time I do not know in what direction it would be desireable to change the dynamic range properties. The present solution is sort of middle way.
Checking RF linearityConnect two signals, both with a power level of +10dBm to the input. Make sure the IM3 level of this test signal is below -50 dB regardless of the load impedance. Check the levels of IM3 products at the output of the RF filters. Use a high impedance probe at the output side of L24 for channel 1 and L31 for channel 2. The IM3 products should be 35dB below the main signals. For the first 25 units, the IM3 level was between -34.8 and -37.4dBc corresponding to an input IP3 of +27dBm for signals within the visible passband. For signals outside the RF filter, IP3 is higher, about +32dBm.
Mixer and AF linearity and balanceThe Delta44 does not quite have the linearity to test the 2.5MHz to audio converter. To check for second order distorsion, apply an RF signal that gives a signal level about 1dB from saturation of the Delta 44. Then attenuate the audio signals 10dB with suitable resistors (a 10dB four-channel audio attenuator with 15-pin d-sub connectors is handy here)Second order distorsion should be at least 100 dB below the main signal when the main signal is placed at about 10kHz. While checking the first 25 units, one was found with the second harmonic 97 dB below the fundamental. This was cured by replacing one of the 74HC4052 IC's. While checking the level of the second order harmonic it is convenient to check for the balance between I and Q. This is done by checking the level of the mirror image. It should be 35dB below the main signal or lower. The mirror image should be checked at a higher frequency also since there are many components in the anti-alias filter and it is perhaps possible to have errors that only affect the gain well above 10kHz. Inject a signal at about 2.540 MHz and compare the main signal at 88kHz to the image at 8kHz. The difference should be at least 20dB.
Checking the noise floorThe Delta 44 is normally operated in is lowest sensitivity mode ("+4dB" with ossmix) to minimize the noise contribution from the internal amplifier in the A/D converter. To check the noise floor of RX2500, set the Delta 44 gain to "-10dB" which will make the gain 12.0 dB higher while the noise floor is lifted by 3.6dB. The sensitivity of Linrad will be as it would have been with an A/D converter having 8.4 dB higher dynamic range but saturation will happen 12dB earlier. The boards are checked by use of the average reading of the S-meter fort H-pol and V-pol at a frequency of 65 kHz. Both channels on all boards give the same noise level, 3.3dB above the Delta 44 at "-10dB". At the normal gain setting of the Delta 44, the 2.5 MHz to audio converter lifts the noise floor by about 0.8dB.
Checking close range reciprocal mixing and noise modulationA test signal at 2.510 MHz, 1 dB below saturation is injected to the channels one by one. The noise floor at a frequency separation of 5 kHz should not increase by more than 2dB in a single channel.No errors were found with this test All units behave identical, possibly because the test signal itself is the limiting factor.
Checking medium range reciprocal mixing and noise modulationA test signal at 2.549 MHz with a level of about 0dBm is injected via a notch filter at 2.524 MHz. This test signal will be stopped by the first notch of the anti-alias filter so very little signal will reach the Delta 44 which is run in high gain mode ("-10dB"). The mixer will see a very strong signal, close to cause saturation of the second AD797.The noise floor should not rise by more than 1.5dB. This test gives the noise floor at 25kHz separation for signals outside the visible passband. The test signal is 15 dB above the normal saturation limit for the Delta 44 but since the card is run in high gain mode, the test signal is actually 27dB above saturation during this test. The noise floor at 72kHz, the frequency for the test is at -141.5dBc/Hz with respect to a signal that precisely saturates the A/D converter in high gain mode so the noise floor of the entire 2.5 MHz receiver is at -168.5dBc/Hz with respect to the test signal. Since the noise is lifted by 1.5dB (or less) the contribution due to reciprocal mixing and noise modulation is about 4dB below the noise floor of the 2.5 MHz receiver itself which means that this test ensures that the noise floor is at least as good as -172 dBc/Hc at a frequency separation of 25kHz. In the first test of 25 units, four of them failed this test, giving a noise floor degradation up to 2.5 dB. These units became normal with a replacement of the 74HC4052 mixer IC's. It seems like the dominating source of phase noise is these IC's. It is possible to bring the noise floor down to -174 dBc/Hz by selecting particularly good IC's but there is no reason. It may be ok to allow 3dB noise degradation (-168dBc/Hz) to avoid having to replace any IC's. The performance of the other converters intended for use together with RX2500 might make this level fully adequate.
Checking sensitivitySet the frequency of a signal generator a few kHz away from 2.5MHz. Connect the generator to channel 1 and set Linrad in normal receive mode. Press "A" to get amplitude margins on the screen.The level required for saturation should be about -15dBm. The amplitude margin readout holds the peak value of the signal. Press "Z" to clear. The amplitude margin readout should show by how many dB your test signal is below the saturation limit. Move the signal source to channel 2 and check that the margin to saturation is the same within 1dB. The first batch of RX2500 was tested with a test signal at 2.508 MHz at at level of -30 dBm (+/-0.1dB). The amplitude margins are shown i table 1.
Board      AD1       AD2       AD3      AD4
 No        (dB)      (dB)      (dB)     (dB)
  1       17.72     17.64     17.54     17.53
  2       17.65     17.56     17.59     17.60
  3       17.58     17.45     17.52     17.52
  4       17.61     17.61     17.51     17.48
  5       17.66     17.52     17.46     17.49
  6       17.57     17.46     17.56     17.55
  7       17.82     17.76     17.62     17.65
  8       17.60     17.44     17.53     17.53
  9       17.52     17.49     17.50     17.61
 10       17.61     17.56     17.56     17.59
 11       17.69     17.63     17.43     17.49
 12       17.64     17.50     17.54     17.61
 13       17.66     17.56     17.52     17.55
 14       17.64     17.59     17.52     17.53
 15       17.58     17.41     17.48     17.52
 16       17.65     17.58     17.71     17.69
 17       17.70     17.63     17.55     17.65
 18       17.52     17.42     17.52     17.43
 19       17.61     17.53     17.40     17.49
 20       17.63     17.56     17.52     17.51
 21       17.78     17.74     17.60     17.61
 22       17.70     17.63     17.55     17.57
 23       17.57     17.55     17.60     17.58
 24       17.67     17.63     17.61     17.63
Table 1.Amplitude margins for RX2500 with -30dBm at 2.508 MHz at the input. All channels are equal within a few tenths of a dB and the level at which the Delta 44 saturates is -12.4dBm.
|