Sampling
The sampling of a wave form must be done at a high enough speed in order to avoid false data. The sampling works like a frequency mixing with half the sampling frequency and overtones of that. Corresponding to mirror frequencies in frequency mixing are the alias frequencies that occur in sampling. The aliasing is a phenomenon produced by the sampling, and it is there regardless if the data is used for a digital filter or for FFT or just a digital recording. To avoid aliasing, no signal at frequencies above a certain frequency may reach the sampling input. Depending on the intended use of the digital data, the permissible maximum frequency may be higher than the Nyquist frequency, which equals half the sampling frequency. Look here for more details on sampling and anti aliasing filtering.
The digital Data
Let us start at some time t = start time, and sample data at 8kHz. We label the data points 0,1,2,3,4..... This means that we will have a row of numbers stored in the computer memory, and these numbers are x( 0 ), x( 1 ), x( 2 ),x( 3 ), .... These numbers are just numbers, but they contain all information necessary to reproduce exactly the original continuos wave form x( t ).x( k ) is a measure of the input voltage at a time, t = start time + k/8000 seconds.
Starting at some particular time, with the corresponding sample point number k, we pick N consecutive points. These points, x( k ), x( k + 1 )..... x( k + N - 1 ) form an array A[k] of length N, where k is the number of the first sample point in A[k]. For the discussion here, comparing FFT to digital filters, the elements of A[k] are denoted A[k](m), where m is the point number within A[k]. Obviously m is in the interval 0 to N-1.
The Fourier Transform
Any array of N points can be expressed as a sum of N arrays, each one describing a sine wave. There is a one to one correspondence between the function of time, the array of N points, and the N amplitudes and phases that describe the N sine wave functions that, when added together, become the time function. The following basic computer program will calculate the fourier transform of an array X of length N:
FOR I=0 TO N/2-1
SUMI=0
SUMQ=0
FOR J=0 TO N-1
SUMI=SUMI+X(J)*SIN(I*J*2*3.141593/N)
SUMQ=SUMQ+X(J)*COS(I*J*2*3.141593/N)
NEXT J
ARE(I)=SUMI
AIM(I)=SUMQ
NEXT I
This is the fourier transform for real valued functions. There are better algorithms, known as FFT algorithms, but they do exactly the same thing. The FFT looks up the sine function values in a table, and it avoids doing the same multiplication over and over again as is done in the simple program above. The result however comes out identical, so for the purpose of discussion the above computer program may illustrate the fourier transform.
The fourier transform for complex valued functions is more efficient to use, but the final result is identical. Look here for details: The Complex Fourier Transform
Frequency Response of the Fourier Transform
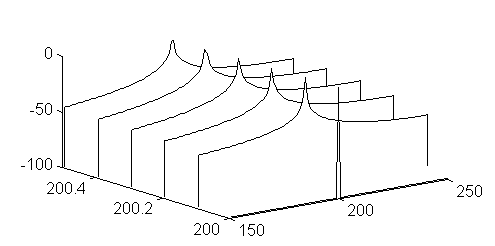
Each amplitude component in the fourier transform corresponds to a sine wave. Each sine wave has exactly 0,1,2... up to N/2 periods within the time spanned by the N samples. A sine wave at some intermediate frequency will be represented in the fourier transform as several different frequencies present at the same time. If we feed a sine wave signal into a 512 point fourier transform, and sweep the frequency, the spectra obtained look like shown in figure 1.The broadening is usually explained by saying that the fourier transform can only represent periodic functions. The discontinuity represented by the mismatch between the beginning and the end of the input data creates "keying clicks" that have a wide spectrum.
If the input data is white noise with only a very weak signal, the broadening due to mismatch at the ends has little influence, but if there is some signal well above the noise, the broadening of it will cause extra noise that may hide weak signals at moderate frequency separations.

Figure 1. Spectral response of 512 point fourier transform.
The width at -20dB varies between 1 and 7 points depending
on if the signal falls on a point or between two points.
For further details look at this table:
Fourier spectra of pure sine waves without windowing
Windowing
The problem of broadening of signals due to mismatch at the ends is solved by windowing. The trick is simple: Force the points to zero at both ends by multiplication by some function that gradually goes to zero at both ends. Obviously a string of zeroes at one end will give a perfect match with the string of zeroes at the other. Windowing removes the tails that stretch far away from the centre frequency, and thus it gives a very significant improvement of the dynamic range. When windowing is used, the resolution becomes lower. The frequency response becomes broader also for sine waves that fit exactly to the fourier frequencies. On the other hand the broadening is controlled and independent on whether the signal is right at a fourier frequency or somewhere between.
An infinite number of window functions is possible.
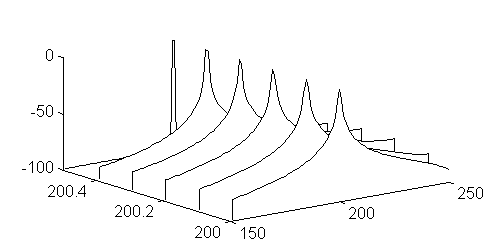
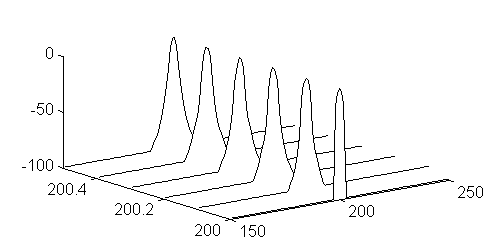
As a demonstration, look at figures 2 to 4.

Figure 2. Fourier spectrum using a sine function for window.
For details, look at this table:
Fourier spectra of pure sine waves with sine window

Figure 3. Fourier spectrum using a sine squared for window.
For details, look at this table:
Fourier spectra of pure sine waves with sine squared window

Figure 4. Fourier spectra of pure sine waves with sine^4 window.
For details, look at this table:
Fourier spectra of pure sine waves with sine^4 window
The stop band rejection is greatly improved by windowing. Each transform uses fewer points, so the bandwidth increases. The window function greatly improves the shape of the filters in the equivalent filter bank - and it also makes the equivalent filters overlap.
The windowing is illustrated in the basic code below, which of course is very inefficient, but gives an identical result as a properly written FFT with a sine squared window.
FOR I=0 TO N/2-1
SUMI=0
SUMQ=0
FOR J=0 TO N-1
SUMI=SUMI+X(J)*SIN(I*J*2*3.141593/N)*SIN(J*3.141593/N)^2
SUMQ=SUMQ+X(J)*COS(I*J*2*3.141593/N)*SIN(J*3.141593/N)^2
NEXT J
ARE(I)=SUMI
AIM(I)=SUMQ
NEXT I
Sliding FFT
When the fourier transform is used without a window function, it is natural to use each point only once, with the notations presented above, this means that the consecutive input arrays for the windowless FFT will be:A[i],A[i+N],A[i+2*N]....
When a window function is used, some points have to be reused because otherwise the points that happen to be the last or the first point in one of the A arrays will be multiplied by zero, and thus have no effect on the final result. From an information theoretical point of view, all points must be equally significant for the final result, and throwing away something like half the input data has to be a serious waist of S/N. The consecutive input arrays to the windowed FFT procedure will be:
A[i],A[i+N/K],A[i+2*N/K]....
K is a number between 2 and N, and how large it has to be depends on the window function.
If K=1, each point is used only one time, and the input data fits the windowless FFT.
If K=N, each point is used N times. This would always be serious overkill, but it is interesting to look AT what the output would be. As an illustration, the basic program for the windowed fourier transform given above is modified to produce an output for one frequency only, but with one data point out for each data point in corresponding to K=N. This means that one frequency in the FFT is selected, and consequently the process will be some kind of digital filter. Let the frequency of interest correspond to the point IFRQ in the FFT output.
1 FOR J=0 TO N-2
X(J)=X(J+1)
NEXT J
WAIT FOR X(N-1) TO ARRIVE FROM A/D CONVERTER
SUMI=0
SUMQ=0
FOR J=0 TO N-1
SUMI=SUMI+X(J)*SIN(IFRQ*J*2*3.141593/N)*SIN(J*3.141593/N)^2
SUMQ=SUMQ+X(J)*COS(IFRQ*J*2*3.141593/N)*SIN(J*3.141593/N)^2
NEXT J
REM DATA IS AVAILABLE IN SUMI AND SUMQ, BUT ONE IS ENOUGH
REM SEND SUMI TO THE D/A CONVERTER
GOTO 1
What we see here is a computer program that makes a FIR filter. (Finite-duration Impulse Response) In fact it is two FIR filters with a 90 degree phase shift between them, but we may neglect SUMQ and just route SUMI through a D/A converter to our headphones. A sine wave with amplitude 1 at the input will have an amplitude of about N/2 (depends on the window), so if the noise is allowed to have a maximum amplitude of about 2 bits below the maximum level of the A/D converter, and if we want the output to saturate for a sine wave 6dB below, SUMI has to be divided by N/16 before it is sent to the loudspeaker.
SIN(IFRQ*J*2*3.141593/N)*SIN(J*3.141593/N)^2 is the impulse response of this digital filter, (J goes from 0 to 2N-1) and we immediately see that the window chosen for the FFT becomes the magnitude response of this FIR filter.
When K=N, the complete fourier transform is a filter bank with N/2 evenly distributed equal digital filters. An average power spectrum is obtained by computing the average of the output signal squared for each frequency. Such average power spectra is the best method for detecting the presence of weak signals in noise. For maximum sensitivity, the length of the window function (in time) should match the coherence length of the expected signal. Too long windows make no harm, but require more computing resources without improving sensitivity.
Using the complex amplitude
Consider the filter above producing SUMI and SUMQ. This complex pair gives a complex amplitude, and this complex number describes the output from the FIR filter. Now, since the filter is narrow, the output has to be a narrow band signal, and consequently SUMI and SUMQ do not change fast with time. The actual numbers change because the reference for the phase angle they describe changes, but if this is taken into account, they change very slowly. This can be used to update SUMI and SUMQ relatively infrequently.
One way to use the complex amplitude is to select a frequency within the FFT, (or a few frequencies if more bandwidth is desired) The filtered output signal is then obtained from the centre part of the backwards fourier transform. If the phase is properly managed, successive inverse transforms will match each other and form a nice filtered output signal. If K is made a little too small, each sequence becomes a little too long, and the matching becomes less good. This would create wide band noise, while saving a lot of computing time. A simple band pass filter at the output (digital, before the D/A or analog after it) will restore a nice signal.
Another way is to use SUMI and SUMQ to set the amplitude and phase of a local tone oscillator at a fixed frequency. The amplitude and phase will be updated every (N/K)'th sample. A quite conventional analog filter at the selected fixed frequency will conveniently remove high frequency clicks which makes very low values for K give satisfactory results.
Demo program for sliding FFT
The "basic program" below is intended to show how the system I currently use for weak signal communication works. The system is implemented in a TMS320C25, which provides two complete sets of FFT's, one for each polarisation of my cross yagi system, and a 80186 that does the rest (and is nearly idle). How to combine the two FFT's coming from two orthogonal polarisations is described here: Adaptive polarisationThe algorithm described below, partly as plain text and partly as basic code, will produce a bandwidth that depends on the window length. For a sin squared window, a suitable value for K is N/4. The window I use with N=512 and K=128 is slightly more rectangular and produces a bandwidth of about 17 Hz. If you wish to listen to it, look here: Station XX, a demonstration of a weak EME signal
This algorithm has two outputs, one for the screen, which is the average power spectrum, and one for the loudspeaker/headphones. Very weak signals are easily seen on the average power spectrum, and the program assumes that the operator has pointed the variable IFREQ to a point close to one of the possible peaks in the power spectrum.
The "program" below is of course only intended to illustrate the method. The real code does not multiply with numbers known to be zero, and it has a buffer allowing the average power spectrum to be calculated from points both before and after the time actually being processed for output. Further, only those transforms containing above average energy close to IFREQ, are used to calculate the average power spectrum.
Subroutine getfft: Wait for N/4 new points to arrive (complex or real).
Produce windowed fft of 3N/4 old plus N/4 new points.
Store the NMAX complex amplitudes in ARE and AIM.
NMAX=N/2-1 for real fft and N-1 for complex fft.
01 CALL GETFFT
Loop I to form average power spectrum.
02 FOR I=0 TO NMAX
03 PWR(I)=127*(PWR(I)+ARE(I)*ARE(I)+AIM(I)*AIM(I))/128
04 NEXT I
Update power spectrum on screen. Possibly small part each time.
Locate the maximum in the power spectrum and get peak shape.
If the level is below MINPWR, keep the old peak position and shape.
05 MAXPWR=-1
06 FOR I=IFREQ-4 TO IFREQ+4
07 IF(PWR(I) < MINPWR)GOTO 11
08 IF(PWR(I) < MAXPWR)GOTO 11
09 MAXPWR=PWR(I)
10 NEWFQ=I
11 NEXT I
12 IF(MAXPWR < 0) GOTO 14
Subroutine shape: Fit a parabola to the max point and
the two surrounding points.
In this way, the frequency will come out with decimals
from the decimal position of the maximum point on this parabola.
Store the frequency as a point number with decimals in IFREQ.
Find the average of the points surrounding the peak (noise floor)
Subtract the noise floor from the peak, and store in PWRCLEAN.
Make PWRCLEAN=0 outside IFREQ +/- 3.
Finally make the sum of the square of all points in PWRCLEAN = 1
13 CALL SHAPE
rem Multiply the complex amplitudes by the normalised cleaned average
rem power spectrum in PWRCLEAN. This is the real filtering.
rem It is a matched filter because it means it means
rem filtering through a filter with a frequency response that
rem is equal to the power spectrum of the signal.
rem If the signal is in one channel only, the process just means
rem pick that channel as it is.
14 FOR I=0 TO NMAX
15 BRE(I)=ARE(I)*PWRCLEAN(I)
16 BIM(I)=AIM(I)*PWRCLEAN(I)
17 NEXT I
Produce a single complex amplitude from those few that remain.
It is not meaningful to do any sophisticated back transformation
because the time between each new fft is too long in this example
(K=N/4). As long as the signal is narrow banded enough to be compatible
with update time interval, just summing points with alternating sign
works fine. The whole procedure becomes equivalent to picking the
complex amplitude at the peak, and it is independent on if the
peak is centred on a point in the fft or between points.
18 S=1
19 REH=0
20 IMH=0
21 FOR I=1 TO NMAX
22 S=-1*S
23 REH=REH+BRE(I)
24 IMH=IMH+BIM(I)
25 NEXT I
If two orthogonal antennas are used in a stereo system, here is the point to combine the two complex amplitudes REH,IMH and REV,IMV into a new set of complex amplitudes in such a way that one contains all the signal (and some noise) and the other contains only noise.
Convert complex amplitude to amplitude and phase.
26 AMPLITUDE=SQR(REH*REH+IMH*IMH)
27 PHASE=ATAN2(REH,IMH)-2*3.14159*IFREQ*(K/N)
Expand the dynamic range of amplitude by table lookup.
Approximately exponential function to compensate for logarithmic
characteristics of human ears.
28 CALL EXPAND(AMPLITUDE)
Restore complex amplitude (with proper phase)
29 REH=AMPLITUDE*SIN(PHASE)
30 IMH=AMPLITUDE*COS(PHASE)
Send REH and IMH to the hardware to generate a sine wave
with this complex amplitude (see diagram below).
Then go back to start of loop.
31 CALL AMPLOUT
32 GOTO 01

One way to produce a sine wave from digital complex amplitudes. The narrow output filter removes clicks from phase and amplitude discontinuities. It also converts the square waves into sine waves.
I guess a soundblaster can produce a sine wave from complex amplitudes directly as two "musical instruments" being a sine and a cosine function. Then, clicks may be removed just by interpolation in the complex phase. It is not necessary to do fft's more often.