To SM 5 BSZ Main PageNormal EME activity weekend
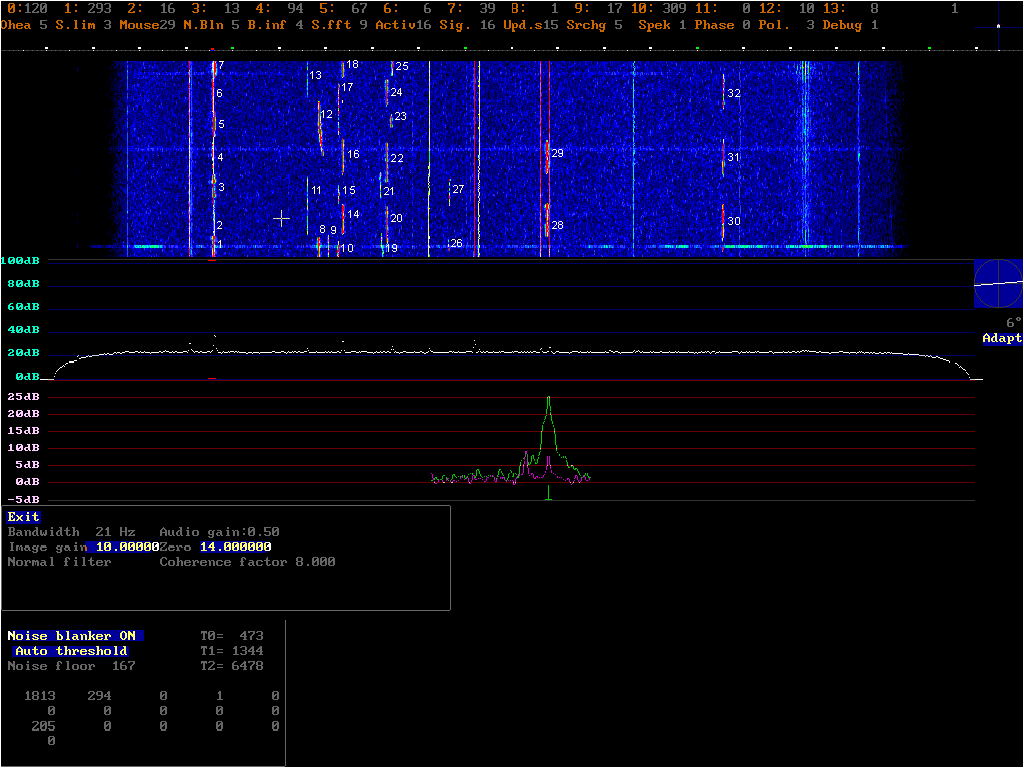
The image below was recorded at about 1600 UT on february 2 1998. At that time several stations were active, and the screen gives a good overwiev of the activity over the latest seven minutes. The figure shows many computer spurs because the Pentium MMX and the SVGA screen are completely unscreened.The screen is the output from the DSP.EXE program. To allow repeated running of the DSP.EXE on the same input data, the signal from the stereo receiver was recorded on a DAT recorder. The DAT recorder does not alter the performance at all as far as I can judge.
The white numbers on the spectrum graph are not output from the DSP.EXE program. The white numbers correspond to the explanatory texts below the figure.
By placing the mouse cursor on a signal (the cross left of 11, SM2LKW) the corresponding signal is routed to the loudspeaker. The filter is automatically centered on the signal and the optimum polarisation is automatically selected.

1. CQ from KB8RQ. Polarisation is +36 degrees linear.
2. Computer spur. This spur is present all the time and it partially masks the two stations on the frequency. The spur is polarised at +21 degrees with about 30% contribution of circular polarisation. Look at the high resolution spectrum which shows the signal with the polarisation that fits KB8RQ in green and the orthogonal signal magenta. The spur is approximately equal in strength, which means that the polarisation is about halfway between 6 degrees and -84 degrees. The combination of 15 degrees angle error and about 30% circular gives this effect.
3. CQ from KB8RQ. Polarisation is +30 degrees linear.
4. DJ7OF calling KB8RQ. Polarisation is -28 degrees linear.
5. QRZ ? JF ? DE KB8RQ. Polarisation is +16 degrees linear.
6. DJ7OF calling KB8RQ. Polarisation is -28 degrees linear.
7. KB8RQ calling DJ7OF with "O" report. Polarisation is +6 degrees linear. Note that the top line of the colour graph is "real time" and that the wide spectrum and the narrow spectrum immediately below correspond to "real time" although the spectra have some averaging to suppress the variations and make the noise floor flat. The red line that is placed on the wide spectrum upper and lower limits is the spectrum range covered by the narrow spectrum. The red dot above the "7" on the graph marks the center frequency of the narrow frequency spectrum. The frequency is 4.55kHz. The green upside down T in the narrow spectrum is a cursor showing the frequency to which the receiver is currently locked. The morse code from KB8RQ was coming out from the loudspeakers while I pressed the button to save the screen image. The Polarisation graph at the right end of the wide spectrum shows the polarisation currently in use (and determined by the computer). If there is some component of circular polarisation, a circle is shown at the center of the polarisation graph, red or green for left or right circular. Usually there is some small circle present, but for a very strong signal, 25 dB above the noise, random errors are very small so the polarisation determination is reasonably accurate. Note that the Faraday rotation changes rather fast. The rotation is about 5 degrees per minute for KB8RQ at this particular time.
8. K2GAL calling SM2LKW. Polarisation is +17 degrees linear.
9. UT5ER calling I3DLI. Polarisation is -137 degrees linear.
10. DF6NA calling QRZ ? Polarisation is -35 degrees linear.
11. SM2LKW calling K2GAL with "O" report. Polarisation is -97 degrees with about 15% circular contribution due to the noise. The signal is too weak to allow an accurate determination of the polarisation. The signal peaks at 10dB above the noise in 5Hz bandwidth in the narrow spectrum. The frequency (scale at top) is 6.6kHz.
12. K2GAL calling SM2LKW. Polarisation is +8 degrees linear.
13. SM2LKW calling K2GAL with "O" report. Polarisation is -120 degrees.
14. I3DLI calling DF6NA. Polarisation is -74 degrees linear.
15. DF6NA calling QRZ ? Polarisation is -30 degrees linear.
16. I3DLI calling DF6NA. Polarisation is -76 degrees linear.
17. DF6NA calling QRZ ? Polarisation is -45 degrees linear. The polarisation angle is less accurate due to the weak signal. The Faraday rotation is probably more or less unchanged over the whole time interval.
18. I3DLI calling DF6NA. Polarisation is -82 degrees linear.
19. RN6MT calling. Polarisation is +22 degrees linear.
20. EA3ADW calling CQ. Polarisation is -45 degrees linear.
21. RN6MT calling. Polarisation is +26 degrees linear.
22. EA3ADW calling CQ. Polarisation is -55 degrees linear.
23. A3 ? (no identification) Polarisation is -71 degrees linear.
24. EA3ADW calling QRZ ?. Polarisation is -61 degrees linear.
25. I1ANP calling EA3ADW. Polarisation is -73 degrees linear.
26. Echo test from unknown station. Polarisation is -55 degrees linear.
27. Echo test from unknown station. Polarisation is -55 degrees linear.
28. I2FAK calling CQ. Polarisation is -62 degrees linear.
29. I2FAK calling CQ. Polarisation is -62 degrees linear.
30. LA9NEA calling CQ. Polarisation is -55 degrees linear.
31. LA9NEA calling CQ. Polarisation is -55 degrees linear.
32. LA9NEA calling CQ. Polarisation is -64 degrees linear.