
BY1QH called by PA0JMV and DL1MAJ Aug 8 1998The figure below is 1024 x 768 pixels dumped from the screen. The signal source was a DAT recorder with a stereo recording of the signals received from the moon on august 8 1998 with a 4x14 elements crossed yagi array. The audio output that was obtained with 25Hz bandwidth and remaining settings as shown in the figure can be downloaded as .WAP files (zipped) here:BY1QH1.ZIP(14k) PA0JMV1.ZIP(16k) DL1MAJ1.ZIP(23k) Download the .ZIP files, unpack them with PKUNZIP to get the corresponding .WAP files. Then use WAVPAC to convert from .WAP to standard .WAV files.
The same sequencies with coherent CW using 22Hz filter
bandwidth can be downloaded here:
The information on the screen image is explained in the figure texts of the small figures below with small cuts from the full screen image in enlarged scale. |

| Fig 1. Full screen image in 1024 x 768 points. |
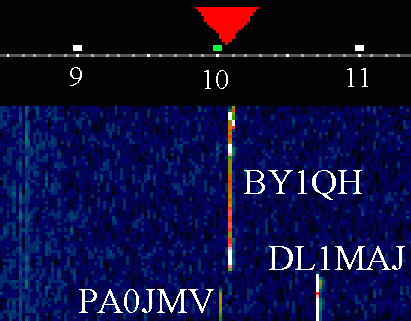
Fig 2. Detail of false colour graph.
The red triangle is the currently selected frequency.
BY1QH is received at an audio frequency of 10.1kHz.
The ruler below the triangle is the frequency scale.
Frequency values are written out here, but not on the full screen
becauce the third line is currently used for debug information.
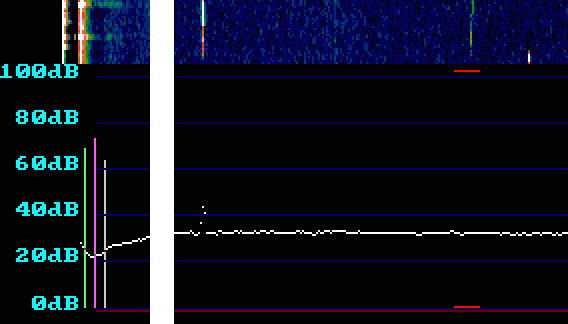
Fig 3. Detail of 100dB unpolarised power spectrum at
30Hz resolution bandwidth with detail of scale at the left.
The frequency scale is the same as for the false colour graph.
This spectrum has the shortest averaging period and no
time delay.
At the time of the screen image BY1QH had switched to
receive mode.
The red lines at 0dB and 100dB and show the width of the
currently selected frequency (range to search for a signal).
The green and the magenta vertical lines immediately right
to the vertical scale show that the largest 16 bit value
read from the A/D converter is at a level of 70 and 75dB
respectively for the two audio channels.
At this particular time the margin to saturation was a little
above 25dB.
The grey vertical line is margin to saturation for MMX
arithmetics (for debug purposes).
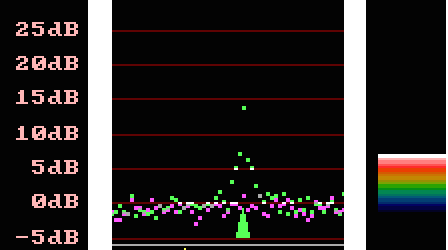
Fig 4. Detail of 30dB polarised power spectrum at
2.7Hz resolution bandwidth with detail of scale at the left.
The green dots are received with the currently selected
polarisation and the magenta dots are received with the
orthogonal polarisation.
The average of the green and magenta points is used to create
the false colour grap.
(Since the total number of points is 8192 at 2.7Hz resolution,
the false colour grap actually uses the largest average in
each group of 8 points)
The colour scale at the right side shows the currently used
scale for the false colour graph.
The green triangle shows the center frequency to which
the PC receiver is currently locked.
The total width of this spectrum (in fig 1) is the the same
as the region marked with red in the 100dB spectrum.
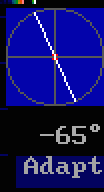
Fig 5. Detail of polarisation information.
The polarisation mode is "adaptive" - by a mouse click
it can be changed to "fixed".
The current polarisation angle is -65 degrees linear.
The very small circular contribution is the red circle
at the center.
In "fixed" mode polarisation is selected by a mouse click on the
figure. (Any linear or right/left circular.)
In "adaptive" the polarisation is set for optimum S/N for
the signal to which the PC radio is locked.

Fig 6. Detail of 30dB frequency stabilised polarised
power spectrum at 1Hz resolution bandwidth.
Note the keying sidebands of BY1QH at +/- 7 Hz from the
carrier.
The curve in yellow is the shape of the currently selected
audio filter.
The red line is the midpoint for the yellow curve.
The green line is the frequency at which the filter currently
is centered.

Fig 7. Detail of frequency vs time information.
The white curve is the frequency as determined from the 8192
FFT data used to create the false colour graph.
The green curve is the final frequency determined from the
high resolution polarised spectrum.
The total time in the window is 90 seconds.
If "coherent detect" is selected a carrier at the frequency
of the green line is used for the reference phase.

Fig 8. Detail of parameter change menu.
"Shape factor" is the 3 to 30 dB shape factor of the
filter used.
At F=1.813 the filter curve is a parabola.
At F=1.0 the filter is a rectangle
"Bandwidth" is the 3dB bandwidth.
"IF gain" and "AF gain" is the gain before and after
the near exponential dynamic range expansion.
Together they control the audio volume and the level at which
the system saturates.
There is currently no AGC function because the PC receiver is
primarily intended for very weak signals.
"Image Gain" and "Zero" are parameters for the false colour graph
scale.
"AF tone" is the frequency at the center of the passband
in the output signal.
"Normal filter" can be changed to "coherent detect"
"Coh.factor" controls coherent detect and indicates how
many times narrower the filter is that extracts the phase
of the signal at the green frequency in fig 7
"Delay, seek width and Lock S/N" are parameters for the
first frequency locking, the white curve in fig 7.
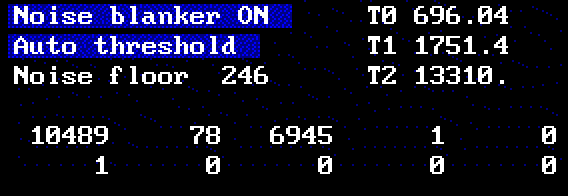
Fig 9. Detail of noise blanker menu.

Fig 10. Detail of phase indicator. (upper right corner)
The white dot shows the amplitude and phase (relative to the
coherent detect phase) of the current processed signal.
At this particular time the distance from the center of the
blue cross (amplitude) is well above the noise and the dot is
close to the positive x-axis so the phase is the same as for
the reference signal at the green frequency of fig 7.
If "coherent detect" is selected, the audio volume is the distance to the right from the vertical blue line. If the dot is to the left the audio signal is zero
If "normal filter" is selected, the audio volume is just the distance from the crossing point between the two blue lines.

Fig 11. The text on the two upper lines is timing information.
Ohea=overhead (uses 14.1% of the total CPU time.)
S.lim=selective limiter (uses 31.6% of the total CPU time)
Reduc=reduce sampling speed (uses 1.7% of the total CPU time)
N.Bln=noise blanker (uses 1.3% of the total CPU time)
The second line gives information about how many blocks of unused data that were present at the exit from the respective function. This number has to be below 32 to make sure no data is overwritten.
The receive main loop in RX.C gives full info about the timing info. This information is software development support only and will be removed.

Fig 12. The little "box" in the upper right corner is buffer
pointer information.
Red dots mark current pointer positions and white dots mark used positions.
Dots at the right side of the box indicate buffer overflow.
The receive main loop in RX.C gives full info about the buffer info.
This information is software development support only and will be removed.