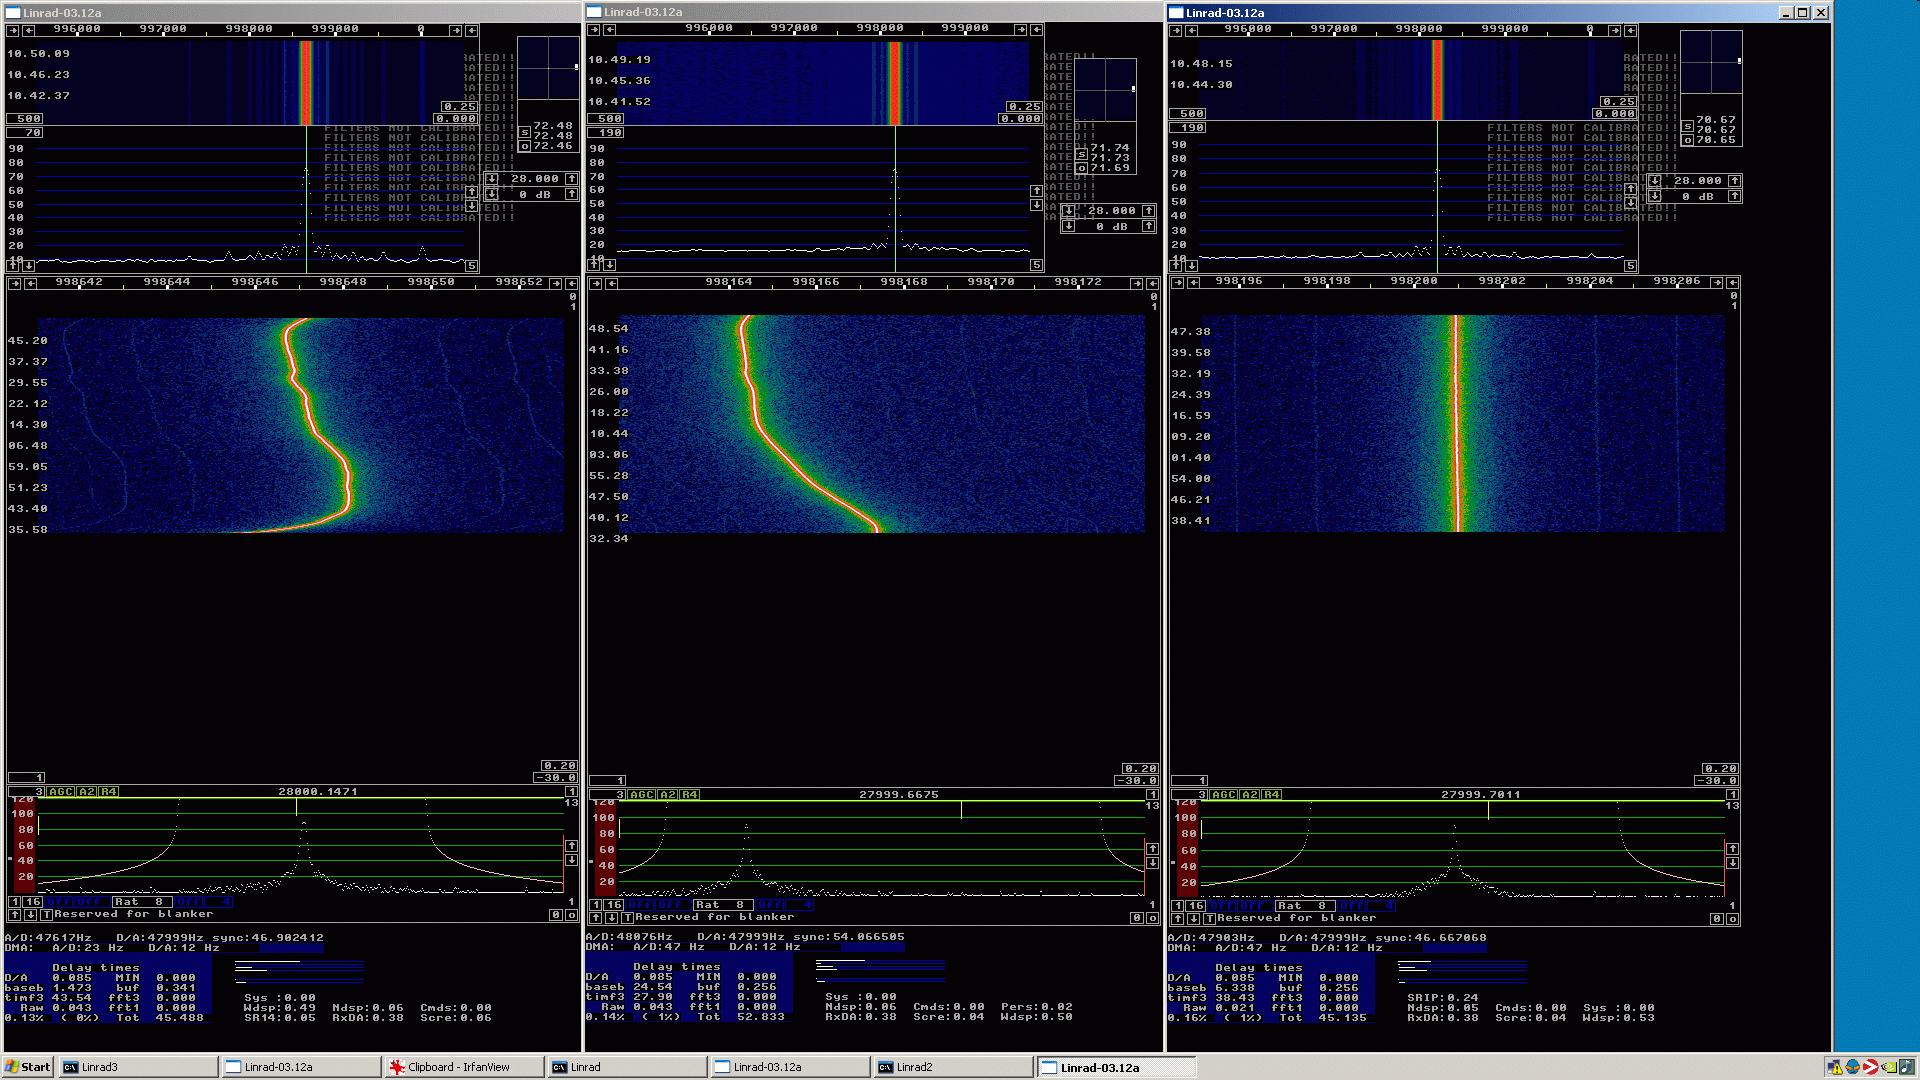
Frequency stability.Figure 1 shows SDR-14, Perseus and SDR-IP(option 01) receiving a signal on 28 MHz. The signal is produced by a HP8657B that is locked to a commercial temperature stabilised reference oscillator. |

|
|
Fig 1.
From left to right, SDR-14, Perseus and SDR-IP (with option 01)
The frequency drift of the SDR-14 and of the Perseus is correlated.
Both units are affected by the changes of the room temperature.
The SDR-IP with option 01 has a temperature stabilised crystal which
is not affected by ambient temperature.
Linrad is run with the same parameters for all hardware and the
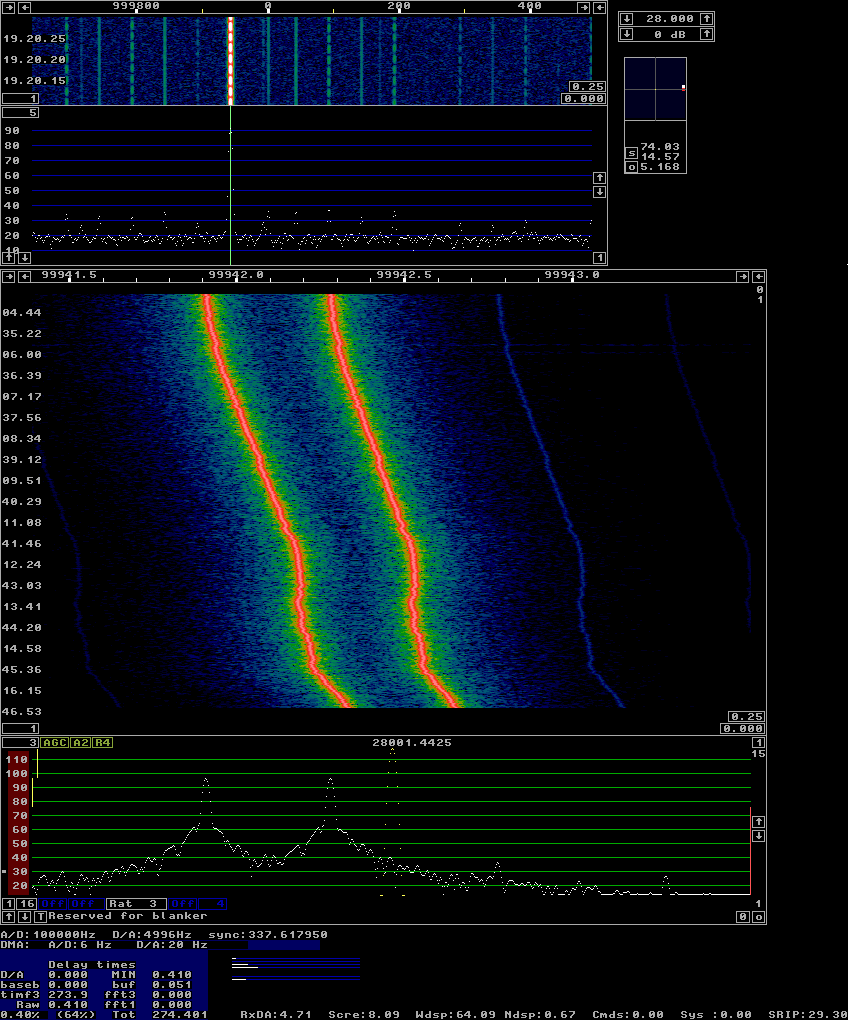
differences are directly visible on screen. The signals are collected for about 1 hour and 15 minutes in figure 1. The SDR-14 was moved a bit just before the measurement started so it made an initial temperature jump. From the later half of the screen dump one can estimate that it is affected by temperature changes by roughly a factor of two compared to the Perseus. That difference is probably not significant. The temperature coefficient is likely to vary from unit to unit by more than a factor of two. The three instances of Linrad were all run with the same processing parameters at an input sampling rate near 48 kHz. The frequency of both SDR-14 and Perseus stays within about +/- 3 Hz for normal temperature variations in a reasonable indoor environment. (Closed doors and windows, no direct sunlight, temperature within +/- 2 degrees and all equipment has been running for many hours.) Figure 2 shows the SDR-IP at higher frequency resolution. The sampling speed into the PC was set to 100 kHz. The "first bandwidth bandwidth reduction in powers of two" was set to 10 which means that the baseband sampling speed was 97 Hz. The transform size was set to 215 for a bin resolution of 0.003Hz (3 milliHz.) Each transform spans 340 seconds, but transforms overlap so the total time spanned by the waterfall in figure 2 is about 10 hours. There are two signals, one of them generated by a HP8657A, the other by a HP8657B. The two HP generators are locked to independent 10 MHz temperature stabilised crystal oscillators. One is the 10 MHz option in a HP 8591A spectrum analyzer, the other is the 10 MHz oscillator in a Navastar GPS time and Frequency reference which is used without any antenna so the signal is the builtin 10 MHz standard without GPS. The signal generators are set to 28 MHz. |

|
|
Fig 2.
The SDR-IP at high resolution during about 10 hours.
Two independent 28 MHz signals are visible.
They are derived from independent frequency standards.
The frequency drift of the SDR-IP seems to be about 0.4 Hz in 10 hours. During this time the frequency separation between the two signals has increased from 108 to 125 pixels which means that the frequency separation has increased by about 0.05 Hz. Note that the main waterfall does not resolve the two signals. They look like a single signal for which the amplitude varies with the beat frequency between the two tones (about 0.3 Hz.) The high correlation between the two traces in figure 2 suggests that the frequency variations are attributable to the SDR-IP while the 10 MHz frequency standards are likely to be one order of magnitude better. (Judged by the separation between the signals that changes by one order of magnitude less.) The 10 MHz frequency standards are old with thousands of hours of service time while the SDR-IP is new. Maybe some months of usage would make it more stable. There are random fluctuations on the frequency from transform to transform. The amplitude is in the order of 1 pixel, 0.003 Hz RMS. These small frequency fluctuations constitute sideband noise. As can be seen in the spectrum, the sideband noise at 0.1 Hz is about 45 dB below the carrier in a bandwidth of about 0.01 Hz (3 pixels, a Gaussian window is used.) That would be something like -25dBc/Hz at a frequency separation of 0.1 Hz. Based on this estimation one would guess that the sideband noise performance for the SDR-IP at 28 MHz is like this: Separation Noise (Hz) dBc/Hz) 0.1 -25 1 -55 10 -85 100 -115Typical performance for the option 01 local oscillator is -110 dBc/Hz at a frequency separation of 100 Hz as one can see from the performance curve at the RFSPACE site. Performance data is given at 80 MHz so they should be corrected by 10 dB for a 28 MHz measurement. The sideband noise estimate from figure 2 is thus within 5 dB from the specification for the SDR-IP oscillator. To SM 5 BSZ Main Page |