Signal delay and group delay.There is a lot to read about filter theory in the literature as well as on the Internet. On this page you will find no mathematics.....A linear receiver (mode CW or SSB) is just a filter and a frequency shifter. There is no detector. For practical reasons one typically uses several cascaded filters and frequency shifters (mixers.) It is the same in analog and digital receivers. For reception of a morse coded signal at e.g. 7.010 MHz one might use a filter that allows signals in the range 7.009875 to 7.010125 MHz to pass and one might shift the frequency to place the 250 Hz wide passband from 300 to 550 Hz in the audio range. The time it takes for a signal to pass through a receiver like that, the signal delay, depends on the signal frequency. To evaluate the signal delay we might send an on-off keyed carrier with a repetition rate of 0.1 Hz and a bandwidth of 1 Hz through the receiver. Assuming that the filter attenuation as well as the signal delay are constants over as little bandwidth as 1 Hz we would find that the signal is totally undistorted by the passage through the filter. The signal would just be delayed a little and attenuated. If we do such a measurement on a real world receiver we would find that the time delay is independent of the frequency in the flat central region of the filter. As a consequence we would find that the phase shift through the filter grows linearly with frequency in the flat center region (phase shift is frequency multiplied by time.) On the skirts it may be different. The time delay in analog filters is typically larger on the skirts which means that the phase response is not linear with frequency. With different time delay at different frequencies a signal that contains energy over the entire passband will have its waveform distorted after passing the filter. Now, that is not as bad as one might believe at first. Distorting waveforms is exactly the purpose we want to use the filter for! Consider the output from a filter when the input is a VERY short pulse. One with a spectral content that is totally flat over a much wider frequency range than the filter bandwidth. The output would be a much smaller pulse that is elongated to something in the order of one over the bandwidth. Surely distorted - we filtered away most of the signal energy.... When looking at the details of the pulse response we may find that the filter output is essentially one pulse or we may find an oscillatory behaviour. In analog filters the oscillations represent the longer delay on the filter skirts and these oscillations, ringings, extend longer with steeper skirts in the filter. Only without a flat center region one can get oscillation-free pulse response. Digital filters can be designed for symmetrical impulse response with the ringings both before and after the main pulse. It corresponds to making the delay through the filter the same at all frequencies. This way digital filters can be made to produce a linear phase response. With a symmetric impulse response the delay measured from the input pulse to the peak of the output pulse would become twice as long compared to a conventional filter having all oscillations after the pulse, but the time from the input pulse until the oscillations on the output have stopped would be essentially the same for filters with similar amplitude responses. The concept group delay has a mathematical definition as the derivative of the phase shift vs frequency. For real world things that transmit signals like cables or bandbass filters the group delay is the same as the signal delay. The time it takes for energy to pass through the filter. Practical measurements.With a standard schottky mixer as the keyer the output of a HP8657A was on-off keyed at a slow enough speed to make the separation between consecutive pulses much longer than the time delay through the receiver under test. The RF pulse as well as the loudspeaker output were displayed on a two-channel oscilloscope. In each case two photos are shown below. One with normal signal level during the pulse and another with 40 dB more RF power where the receiver is saturated during the pulse making ringings after the pulse visible down to about -60 dB.Both the FT-1000D and Linrad were set to a nominal bandwidth of 250 Hz. The measured frequency responses are displayed in figure 1. |

|
|
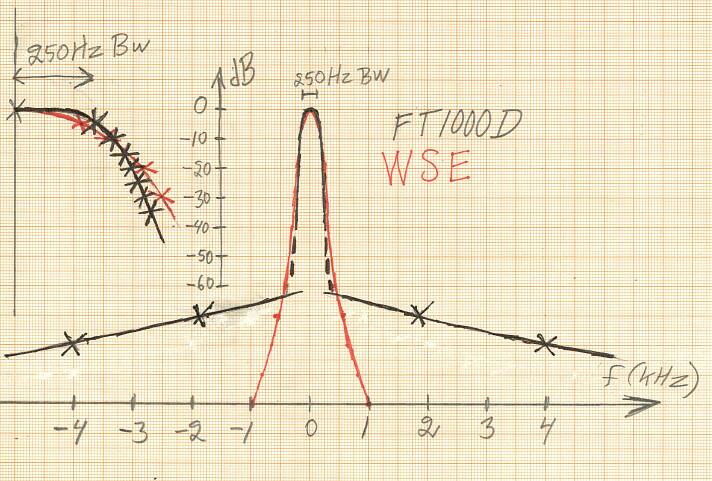
Fig 1. The frequency response of FT-1000D (black) and
Linrad with the WSE converters (red).
The curves on the left is half the symmetric frequency response
at a 10 times expanded frequency scale.
Linrad is set for minimum processing delay with the -60 dB
bandwidth similar to that of the FT-1000D.
It is clear from figure 1 that the FT-1000D has a better shape factor as compared to Linrad. The reason is that Linrad is set for its fastest response and that therefore the filter response is created by use of only a single bin in the corresponding FFT. The relevant Linrad mode parameters were selected as follows: First FFT bandwidth [400] First FFT window [9] Enable second FFT [0] Enable AFC [0] First mixer bw reduction [3] Third FFT window [4] The global parameter "Max DMA rate" was set to its maximum value 999 and interrupt rates actually used were 750 Hz both for input and output. The computer running Linrad was a 2.6 GHz PentiumIV running Linux, Debian Etch in terminal mode with svgalib. When using X11 it is necessary to limit the max DMA rate to avoid overrun and underrun errors. The effect on the delay time is small also 375 Hz is a high DMA rate with small buffers and an associated small delay time. The time delay from antenna to loudspeaker is much longer under microsoft Windows, about 70 ms. The reason is unknown, but it is very likely that the Windows version of Linrad can be improved. The Linrad version used to produce this page was Linrad-03.03. The FT-1000D has a limited dynamic range due to reciprocal mixing. The black lines that intersect the selectivity curve at about -63 dB show the point where S/N is degraded by 3 dB due to reciprocal mixing. More stop band attenuation than 70 dB is therefore useless in the FT-1000D. Linrad with WSE converters does not suffer from reciprocal mixing and produces more than 40 dB better dynamic range than the FT-1000D at 2 kHz separation. No details here, measurements at those levels are not trivial. The time delay through the FT-1000D is shown in figure 2 while the time delay through the WSE converter and the computer running Linrad is shown in figure 3. |

|
|
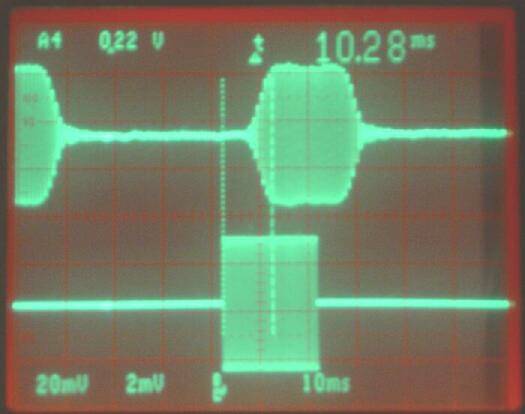
Fig 2. FT-1000D. The upper trace is the loudspeaker
output and the lower trace is the antenna signal.
The time delay is about 10 ms.
|

|
|
Fig 3. WSE and Linrad. The upper trace is the loudspeaker
output and the lower trace is the antenna signal.
The time delay is about 30 ms.
Figures 2 and 3 are made with a non-saturating signal. They do not represent what would be heard under real QSK operation since the leak-through of the own transmitter is likely to be very much stronger. Figures 4 and 5 show the same thing with 40 dB more RF signal. |

|
|
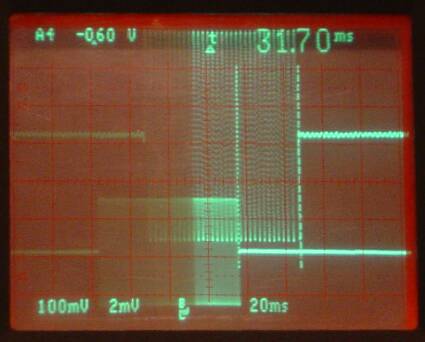
Fig 4. FT-1000D. 40 dB more signal compared to
figure 2. The upper trace is the loudspeaker
output and the lower trace is the antenna signal.
The time it takes for the receiver to become quiet is
about 30 ms. It would be more for a stronger signal.
|

|
|
Fig 5. WSE and Linrad. 40 dB more signal compared to
figure 2. The upper trace is the loudspeaker
output and the lower trace is the antenna signal.
The time it takes for the receiver to become quiet is
about 30 ms. Independent of the signal level.
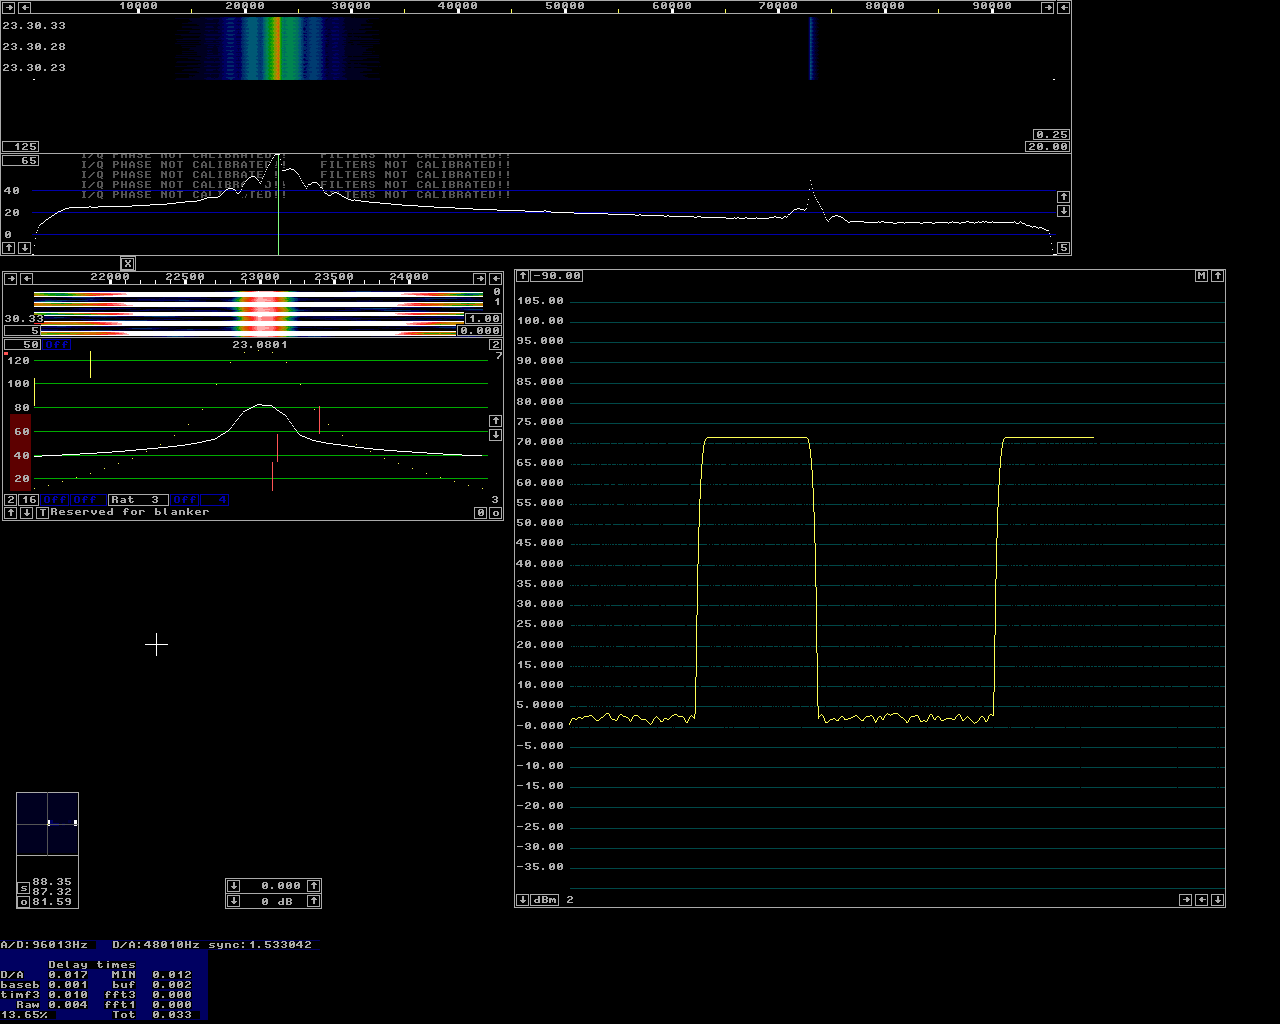
Figure 6 shows the Linrad screen while the delay measurement producing figure 5 was made. As can be seen in the lower left corner the delay as computed by Linrad is in good agreement with the measurement from antenna connector to loudspeaker. At the moment when figure 6 was captured, the amount of data in the output buffer corresponded to 17 ms. The minimum amount of data from the time when the signal was selected was 12 ms which is sufficient when Linrad is the only user program running. |

|
|
Fig 6. The Linrad screen during the measurement
producing figure 5.
It is obvious from the figures above that both FT-1000D and Linrad (under Linux) can be used for full QSK at as narrow a bandwidth as 250 Hz. The frequency response of Linrad has an oscillatory behaviour that is not shown in figure 1. Attenuation is actually much better than shown in the figure when the interference is located an integer number of FFT bins from the center frequency. To get an idea about the selectivity and dynamic range of the Linrad plus WSE receiver, look at figure 7. Here a good crystal oscillator is sent into the WSE converters and the frequency is tuned to the worst point with equal amplitude in two frequency bins. All settings are the same as in figure 6 except for the Y scale in the baseband graph. The -100 dB point is 1.1 kHz while -110 dB is at 1.6 kHz. The noise floor is at about -118 dB. When the frequency is tuned to place the signal exactly on a frequency bin, the response is much narrower. |

|
|
Fig 7. The baseband spectrum of a good crystal oscillator.
To SM 5 BSZ Main Page |