Previous results.
This page is a repetition of a previous study with a HP8712C. That study resulted in these values for the three cable sections intended to create a 1:1.5 SWR at four phase angles:DUT1: Dissipative loss=0.0323 dB
DUT3: Dissipative loss=0.0209 dB
DUT8: Dissipative loss=0.0358 dB
Those values were obtained after using the impedance data with insertion loss measurements using a signal generator and a receiver.
The summed loss is 0.0890 dB but the uncertainty in the summed loss is too high to make it useful for absolute NF measurements using these cable sections to map the NF vs impedance surface. This page is the first step to try to improve.
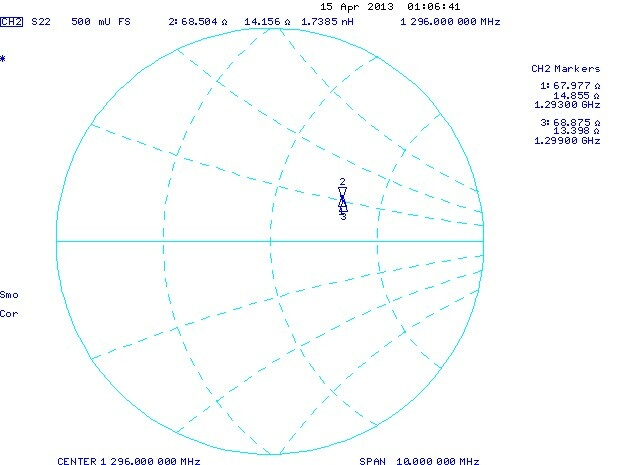
The impedance of the Rx port with with DUTs.
The Rx port is a dual circulator preceeded by a 30 cm section of 3 mm semirigid coaxial cable. The semirigid is squeezed to present a nice impedance at the female SMA connector.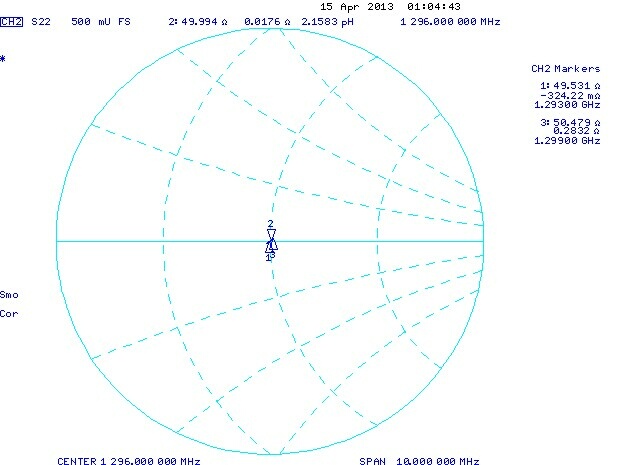
| |||||||||||||||||||||||||||
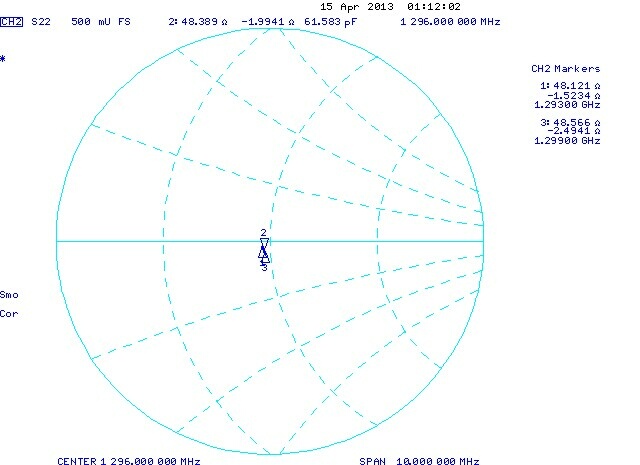
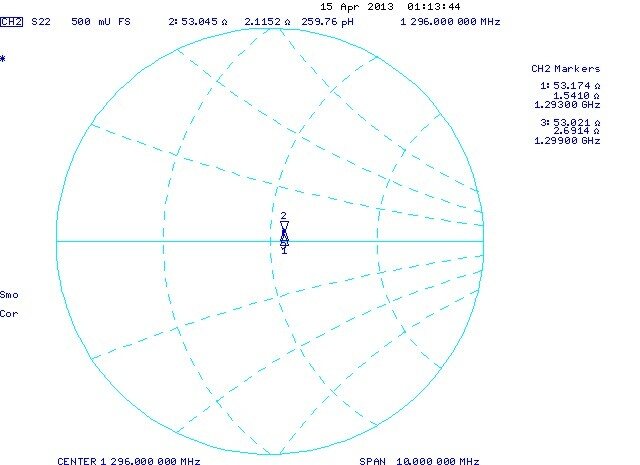
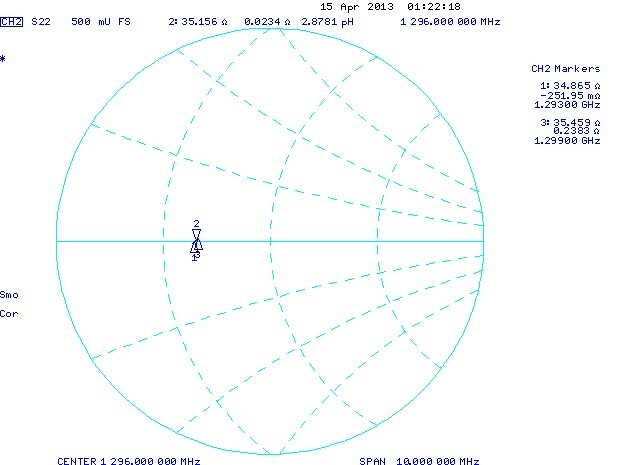
| Figure 1. The impedance of the female SMA connector to be used for insertion loss measurements. | |||||||||||||||||||||||||
8712C 8753E
Device Zre Zim Zre Zim
(Ohm) (Ohm) (Ohm) (Ohm)
none 52.02 0.21 49.99 0.02
DUT1 50.34 0.69 50.54 0.73
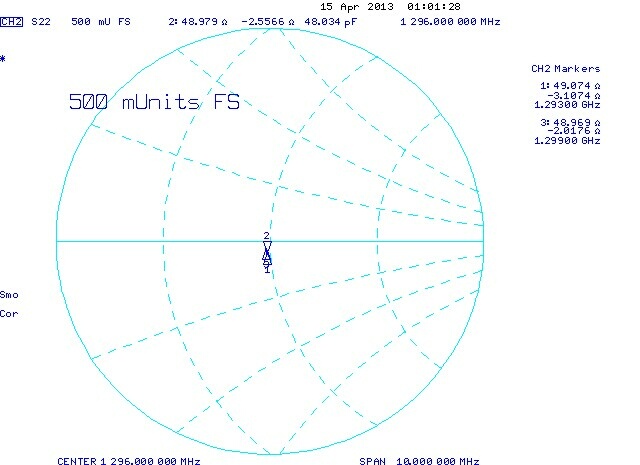
DUT3 49.09 -2.56 48.39 -1.99
DUT8 71.81 0.51 68.56 10.56
DUT13 54.04 2.24 53.05 2.12
DUT18 36.77 4.60 35.16 0.02
DUT31 49.67 -1.00 48.98 -2.56
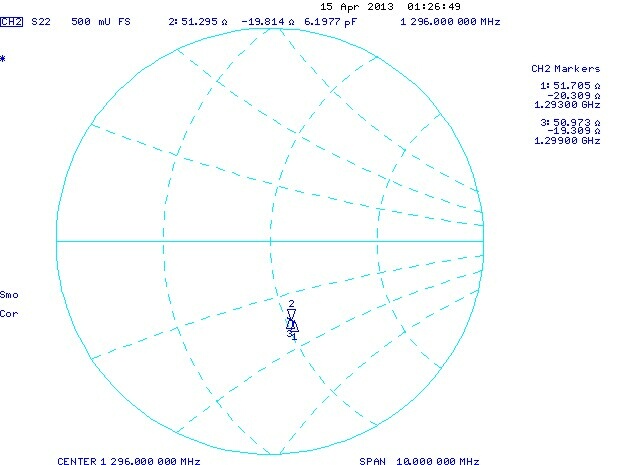
DUT38 45.70 -17.41 51.30 -19.81
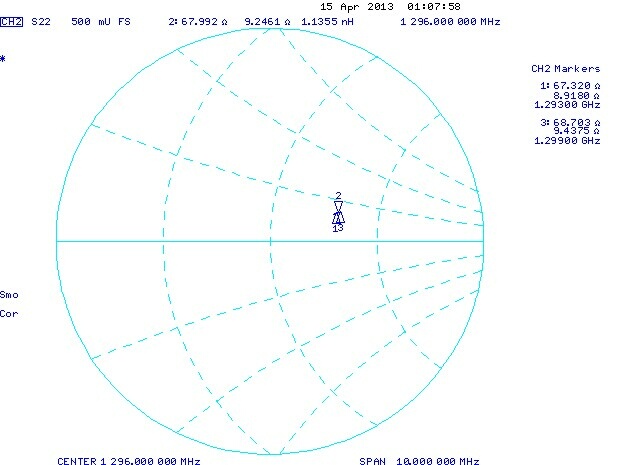
DUT81 74.35 0.20 67.99 9.25
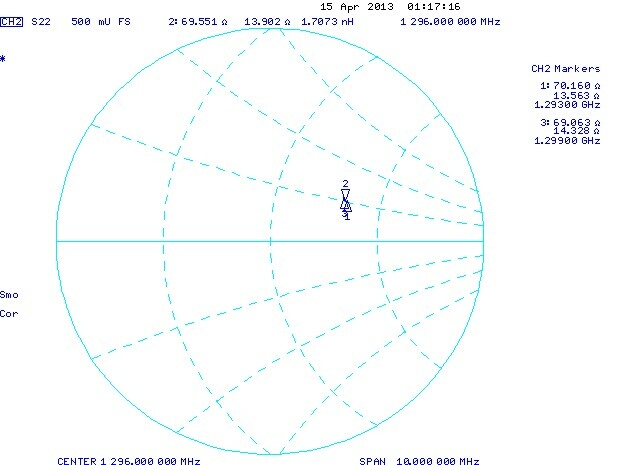
DUT83 75.04 5.42 69.55 13.90
DUT138 59.53 19.49 49.44 20.43
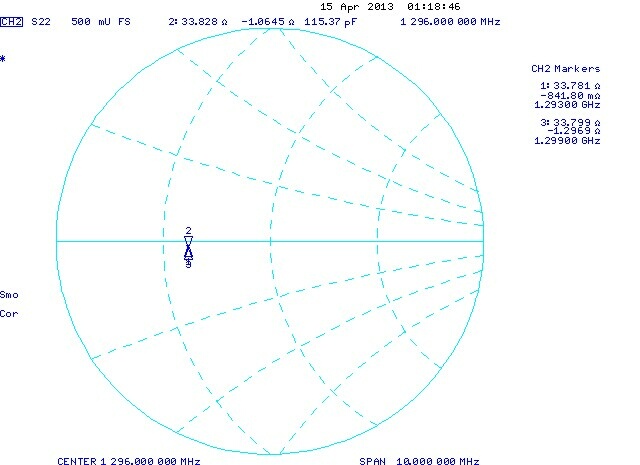
DUT183 34.89 3.87 33.83 -1.07
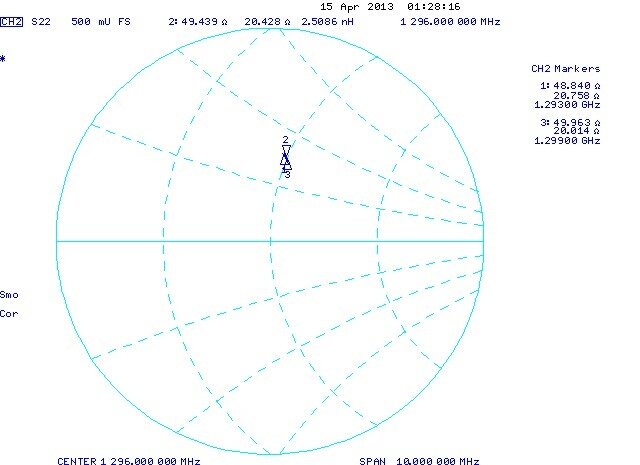
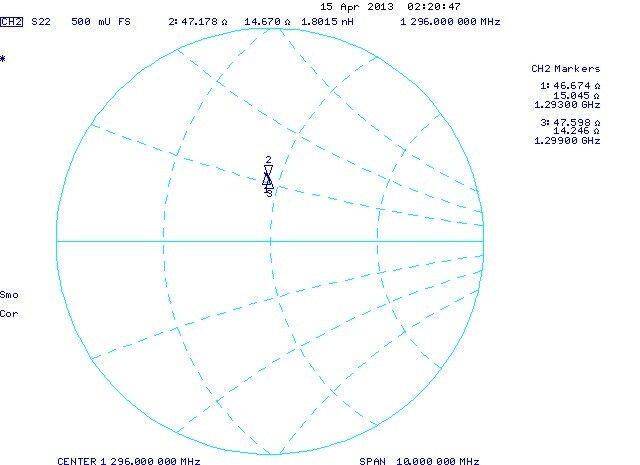
DUT318 55.75 14.82 47.18 14.67
DUT381 44.59 -18.52 50.66 -19.16
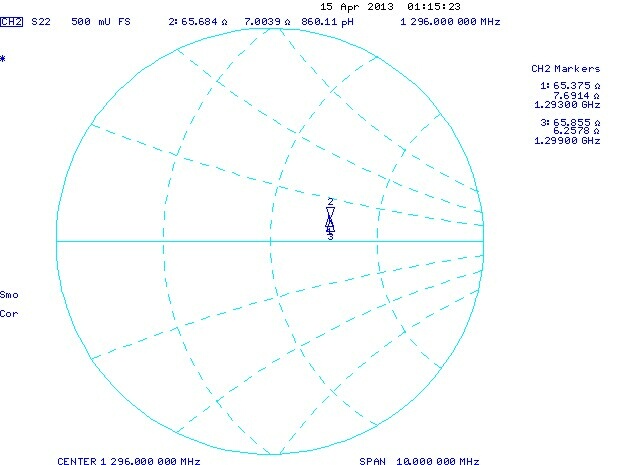
DUT813 69.27 -2.47 65.68 7.00
DUT831 74.80 2.61 68.50 14.16
| |||||||||||||||||||||
|
Table 1. Raw data from the HP8753E network analyzer with the different DUTs on the female SMA connector compared to the corresponding data from the 8712C. | |||||||||||||||||||
At a first inspection table 1 seems to show large discrepancies between measurements using 8712C and 8753E. The reason is that the 8712C was calibrated with an incorrect delay for the (homemade) calibration kit. After applying a phase shift of -22.4 degrees on the 8712C data the results from the two instruments compare as shown in table 2. | |||||||||||||||||
             8712C               8753E               Diff.
Device    Zre      Zim         Zre      Zim         Zre      Zim
         (Ohm)    (Ohm)      (Ohm)     (Ohm)

none    (51.78    0.97)     (49.99    0.02)     ( 1.79    0.95)
DUT1    (50.05    0.77)     (50.54    0.73)     (-0.49    0.04)
DUT3    (50.13   -2.74)     (48.39   -1.99)     ( 1.74   -0.75)
DUT8    (68.79   10.14)     (68.56   10.56)     ( 0.23   -0.42)
DUT13   (52.80    3.61)     (53.05    2.12)     (-0.25    1.49)
DUT18   (36.12   -0.03)     (35.16    0.02)     ( 0.96   -0.05)
DUT31   (50.08   -1.05)     (48.98   -2.56)     ( 1.10    1.51)
DUT38   (52.78  -19.07)     (51.30  -19.81)     ( 1.48    0.74)
DUT81   (71.01   11.18)     (67.99    9.25)     ( 3.02    1.93)
DUT83   (68.92   15.65)     (69.55   13.90)     (-0.63    1.75)
DUT138  (50.89   20.04)     (49.44   20.43)     ( 1.45   -0.39)
DUT183  (34.53   -1.23)     (33.83   -1.07)     ( 0.70   -0.16)
DUT318  (49.55   14.98)     (47.18   14.67)     ( 2.37    0.31)
DUT381  (52.06  -20.75)     (50.66  -19.16)     ( 1.40   -1.59)
DUT813  (68.19    6.38)     (65.68    7.00)     ( 2.51   -0.62)
DUT831  (70.13   13.33)     (68.50   14.16)     ( 1.63   -0.83)
| |||||||||||||||
|
Table 2. Raw data from the HP8753E network analyzer with the different DUTs on the female SMA connector compared to the 8712C data with a phase shift of -22.4 degrees | |||||||||||||
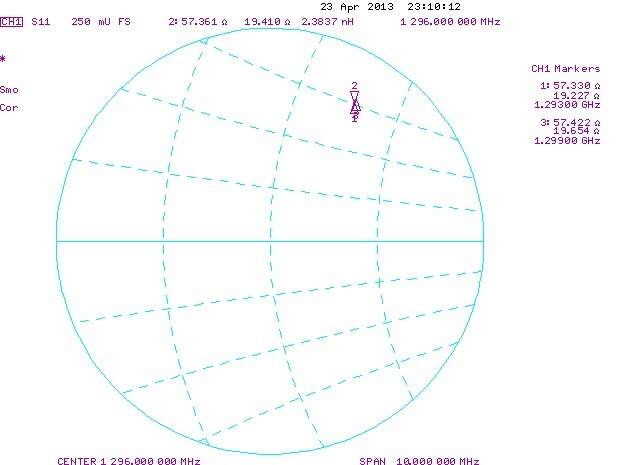
The differences in table 2 are largely due to the impedance of the Rx port itself. I was tuned slightly differently for the two series of measurements. The simple fortran program used to find the phase difference and to shift the phase can be downloaded here zcomp.tbz (4950 bytes) The impedance of the Tx port with with DUTs.The port is a 40 dB attenuator followed by an impedance stable cable, a Flexiform 401, which is carefully arranged to to be movable to insert the different DUTs without going outside elastic bending. Internal strain in the cable was relaxed with a heat gun. Between the cable and the attenuator a short section of 0.5 inch Flexwell was inserted for impedance tuning. The Flexwell section has several screws that can be used to tweak the impedance. Figure 1 shows the impedance seen with the 8753B. The network analyzer was placed in a position to allow impedance measurement without bending the Flexiform 401 cable. | |||||||||||
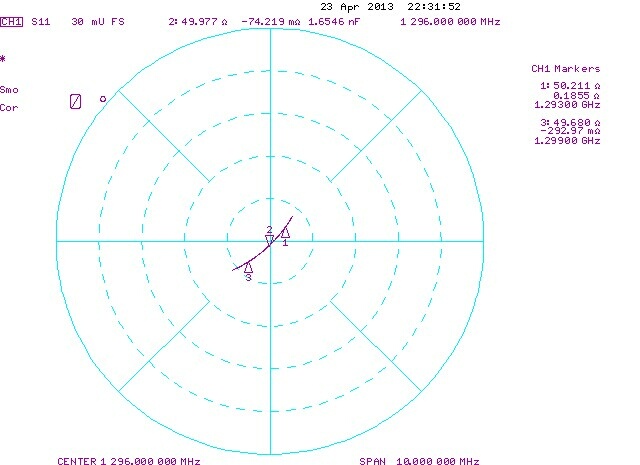
| |||||||||
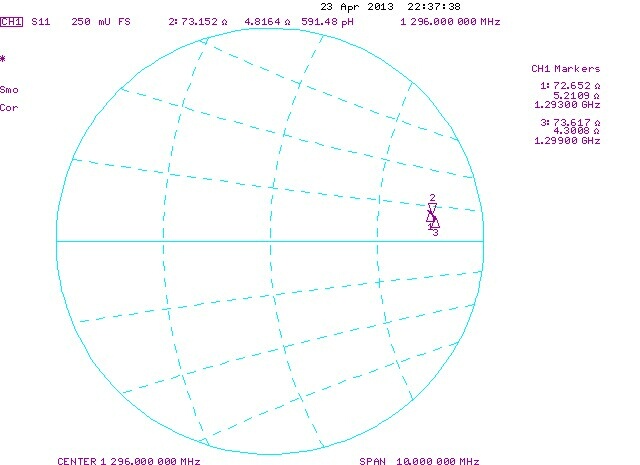
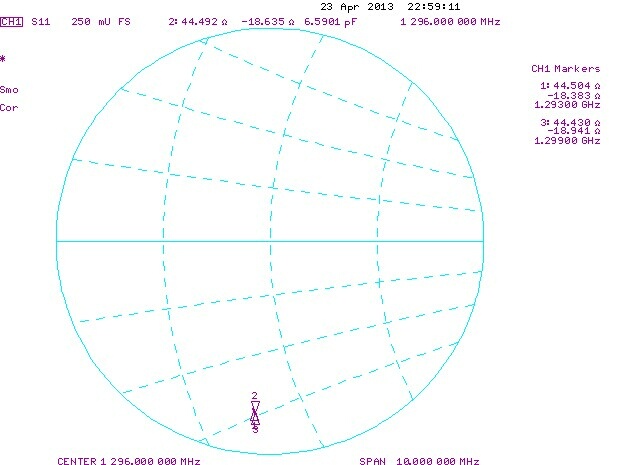
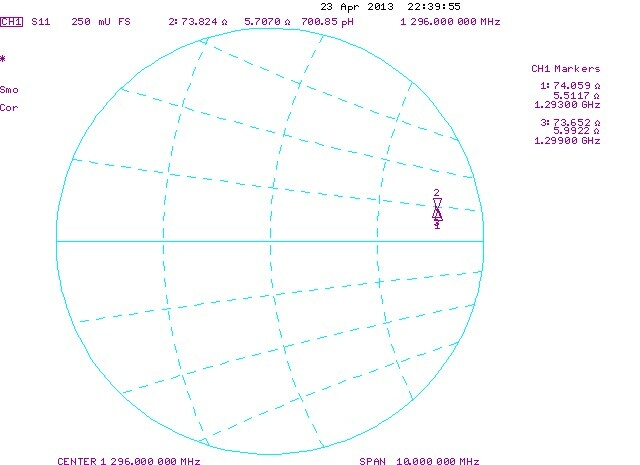
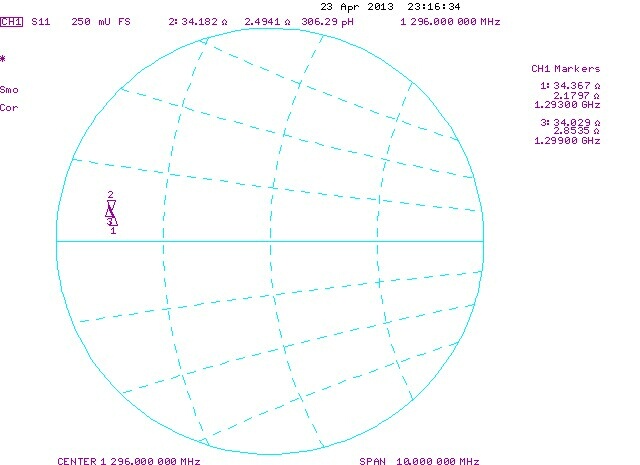
| Figure 2. The impedance of the male SMA connector to be used for insertion loss measurements. | |||||||
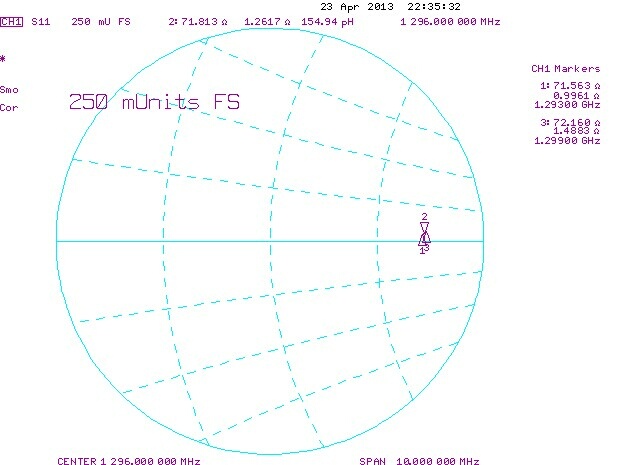
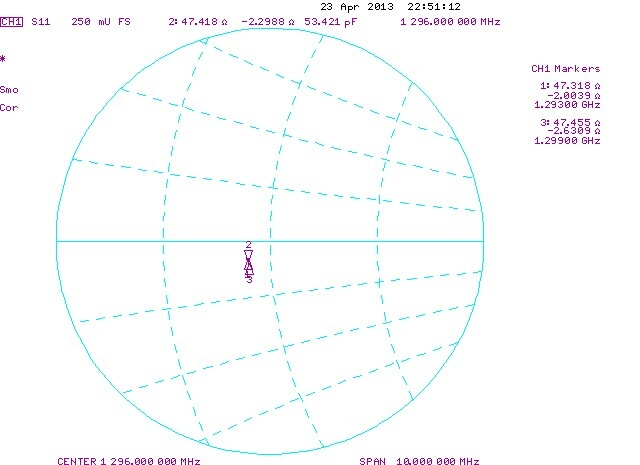
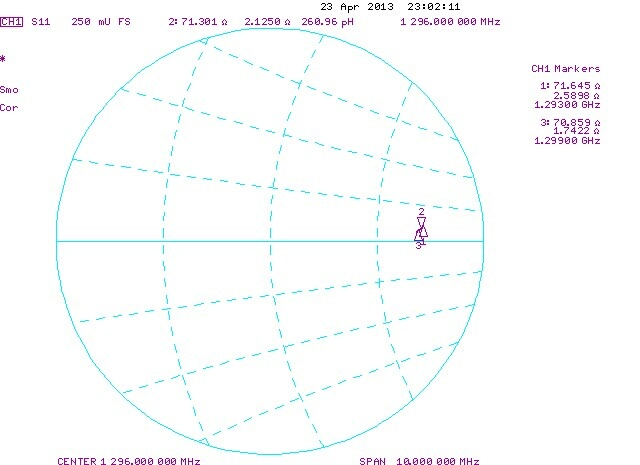
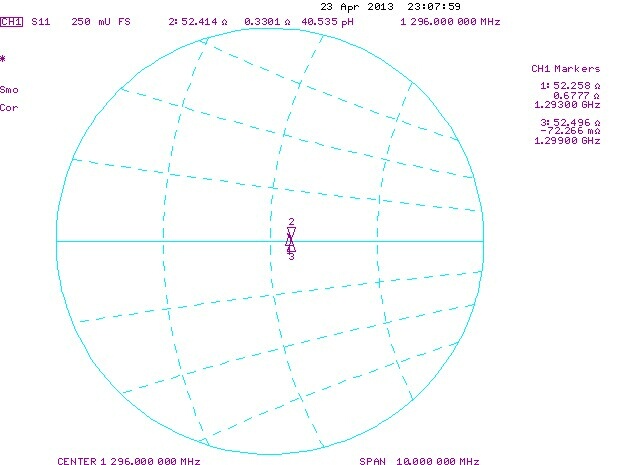
While keeping the Flexiform cable in the same position the different DUT were inserted and the impedances measured. Data with links to VNA screen dumps data is given in table 1. As a comparison the data from the previous study with the 8712C is included. | |||||
Device    Zre      Zim
         (Ohm)    (Ohm)
none     49.98    -0.07
DUT1     50.06    -1.08
DUT3     48.45    -2.20
DUT8     71.81     1.26
DUT13    47.42    -2.30
DUT18    71.30     2.13
DUT31    52.41     0.33
DUT38    73.15     4.81
DUT81    35.42     3.87
DUT83    44.49   -18.64
DUT138   73.82     5.71
DUT183   45.26   -18.94
DUT318   68.05    -0.47
DUT381   34.18     2.49
DUT813   52.42    15.00
DUT831   57.36    19.41
| |||
|
Table 3. Raw data from the HP8753E network analyzer with different DUTs on the male SMA connector. | |