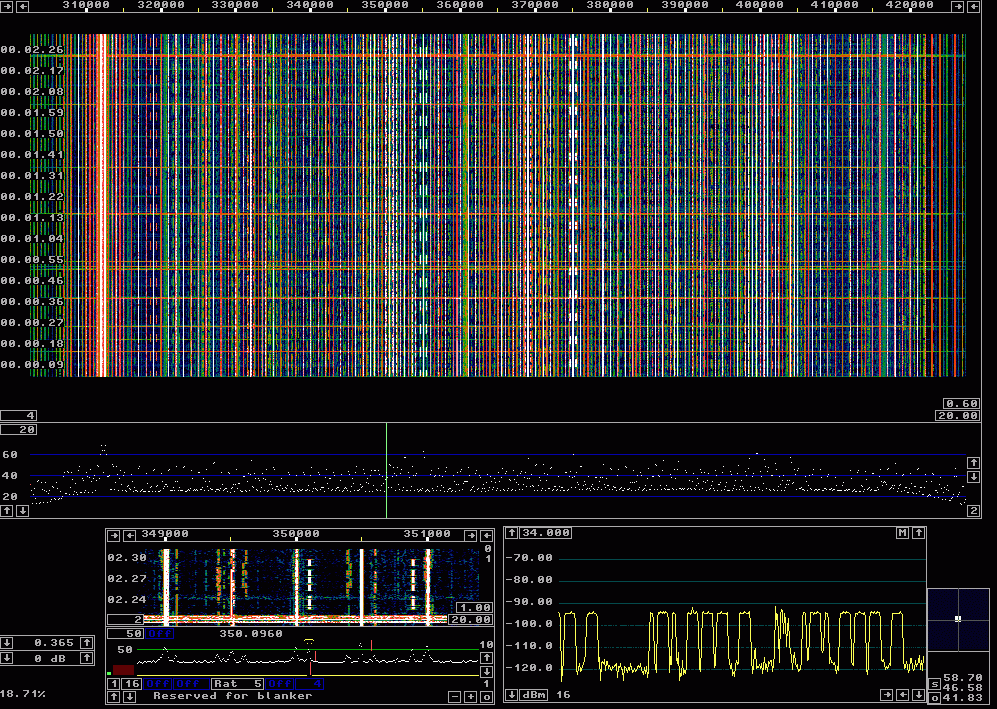
Fig 1.All of the ndb-315-415_013.wav in a waterfall. The signal ROT at 350.1 kHz is selected and visible in the baseband graph as well as in the S-meter graph.
Non-directional beacons.A Non-directional beacon (NDB) is a radio transmitter at a known location, used as an aviation or marine navigational aid. Besides their use in navigation, NDBs are also popular with DXers. NDBs transmit their Morse Code callsign, they are very easy to identify, making NDB monitoring a very entertaining niche within the DXing hobby.A wideband recording.The 125 kHz wideband recording presented on this page, /ndb-315-415_013.wav (112902144 bytes) was recorded on April 15, 2008, starting at 00:30 UTC by Roelof, PA0RDT on a Perseus HF receiver in Middelburg, Netherlands, locator JO11tm. The zipped file can be downloaded here: http://sm5bsz.com/linuxdsp/usage/ndb/ndb-315-415_013.zip (82910183 bytes) The antenna used was a special edition of the PA0RDT-Mini-Whip, built inside half a film canister and mounted 5 metre up the stem of a magnolia tree 6 metre from the house. Conditions were fair to good, but not exceptional.Figure 1 shows the Linrad screen when processing the file to produce a waterfall graph for the entire range in frequency and time. In figure 1 Linrad is run without any noise blanker on an AMD Athlon at 850 MHz. The station ROT at 350.5 kHz is Rotterdam Airport at a distance of 79 km. The power is 25W but the ERP is only 150mW with the small antenna of this station, a 15 meter high centre loaded vertical. ROT has its lower modulation sideband at 350.1 kHz and this is the signal to which Linrad is tuned. There are occasional lightening crashes, the last one, near the end of the recording reaches the same level as the ROT signal as can be seen in the S-meter graph. |

Fig 1.All of the ndb-315-415_013.wav in a waterfall. The signal ROT at 350.1 kHz is selected and visible in the baseband graph as well as in the S-meter graph. |
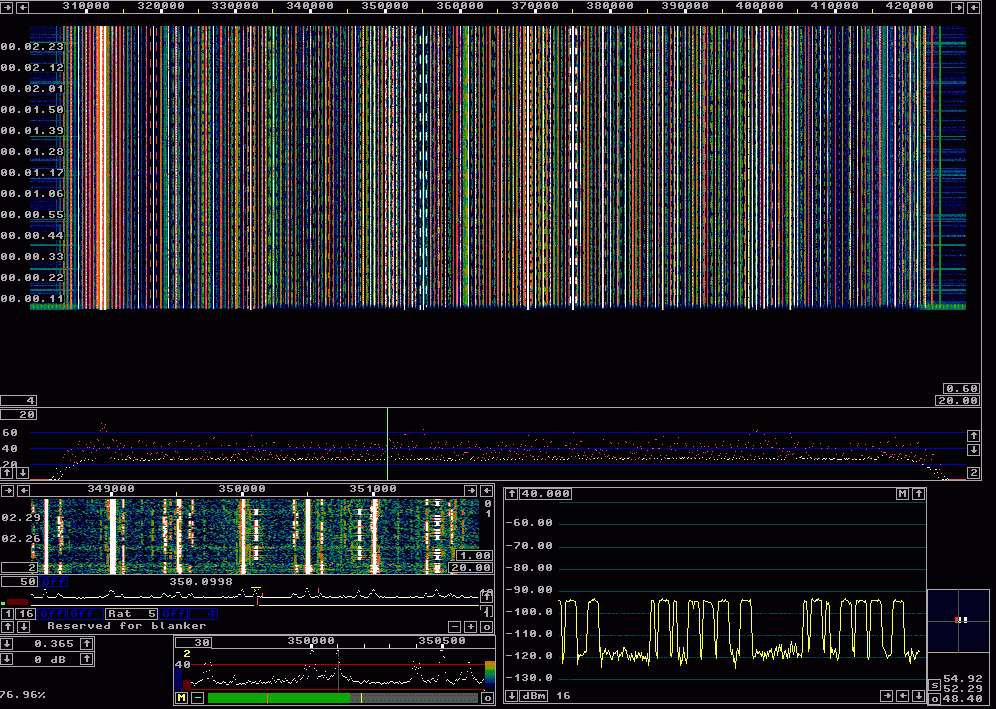
Fig 2.Here the second FFT is enabled and the dumb noise blanker is running. |
Figure 2 shows the entire waterfall graph of the ndb-315-415_013.gif file
with the second fft enabled and with the dumb noise blanker running.
Calibrating the system to allow the smart blanker does not give
any advantage since the QRN is non-local with a pulse shape that is
not defined by the receiver characteristics.
In figure 2 the second FFT is run with fft versions=0 which means that
floating point arithmetics is used.
This is the explanation for the high CPU load, 76.96% in figure 2.
There is no reason for this, but with a fast enough computer like the
Athlon 850 MHz, it does not matter.
Narrowband processing.The number of beacons that can be identified in the wideband recording is very large. Below are a couple of examples on how different beacons look on the Linrad screen and what the output audio files look like. All the examples below are made with an AMD Athlon 850 MHz processor with 633 megabytes of memory.BLA-350 and STM-350 on 348.979 kHz.The station in Biella/Cerrione, Italy, at a distance of 750 km, identifies itself with BLA. The station near Santarem, Brasil, 8113 km away identifies itself with STM. Both stations use 1020 Hz tone modulation and their modulation sidebands are close in frequency. Figure 3 shows the Linrad screen when the frequency 348.979 kHz is selected. The figure is captured after the entire file is processed and the screen has became static. (The white letters STM and BLA are added manually to the gif file with an image editor.)Biella/Cerrione, Italy, BLA, is received at a signal level of -110 dBm while Santarem, Brasil, 8113 km away, STM, is at -117 dBm. The RMS noise floor is at -127.5 dBm in a bandwidth of 11 Hz so S/N is 10 and 17 dB respectively and the signals are not difficult to hear in the loudspeaker output bla.mp3 (999936 bytes) So far STM is the most distant NDB received in Middelburg, Netherlands. It features a 700 W transmitter and the antenna is a 72 metre high tower. This station is regularly heard in North America. The first time ever logged in Europe was October 28, 2007. |

Fig 3.BLA and STM on 348.979 kHz. |
|
To reproduce figure 3 and the loudspeaker output on your own computer under Microsoft Windows, follow these instructions:
The signal from your soundcard should be identical to bla.mp3 except for a few seconds in the beginning when fine-tuning was made slightly differently. It is a good idea to use head-phones when listening to weak signals like these that have been filtered through narrow filters. L-350 on 351.056 kHz.Albacete, Spain, 1459 km, identifies itself with L. Figure 4 shows the Linrad screen when receiving Albacete, L-350, in normal mode as a conventional SSB receiver with a narrow filter. The loudspeaker output l.mp3 (943992 bytes) can be used as an input to Linrad and figure 5 shows the spectrum of this file among other things. |
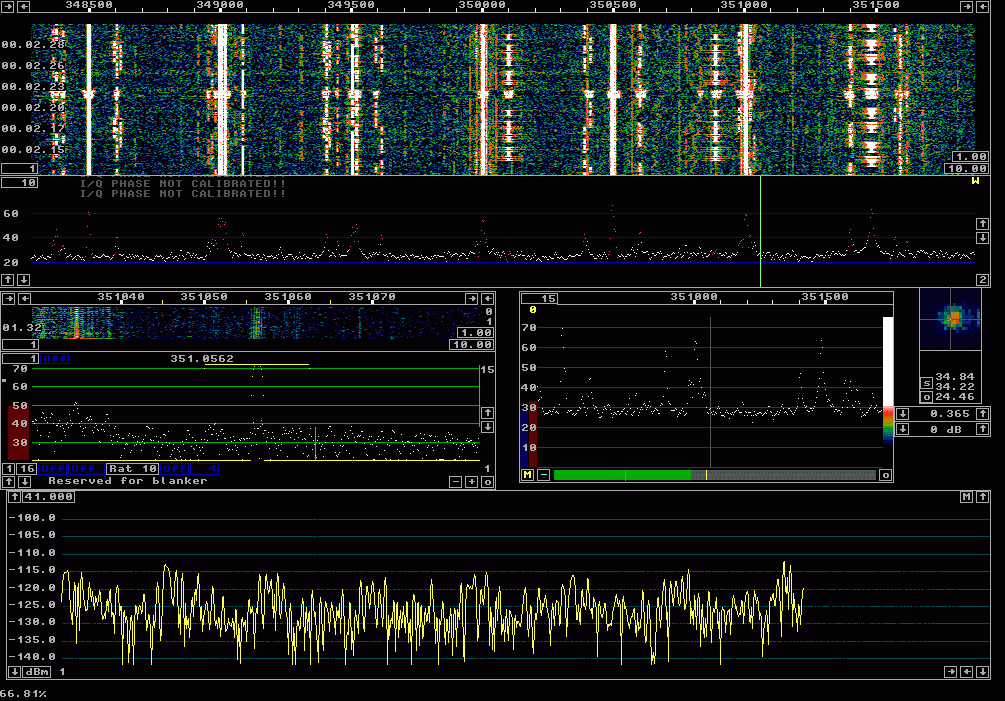
Fig 4.L on 351.056 kHz. |
|
|
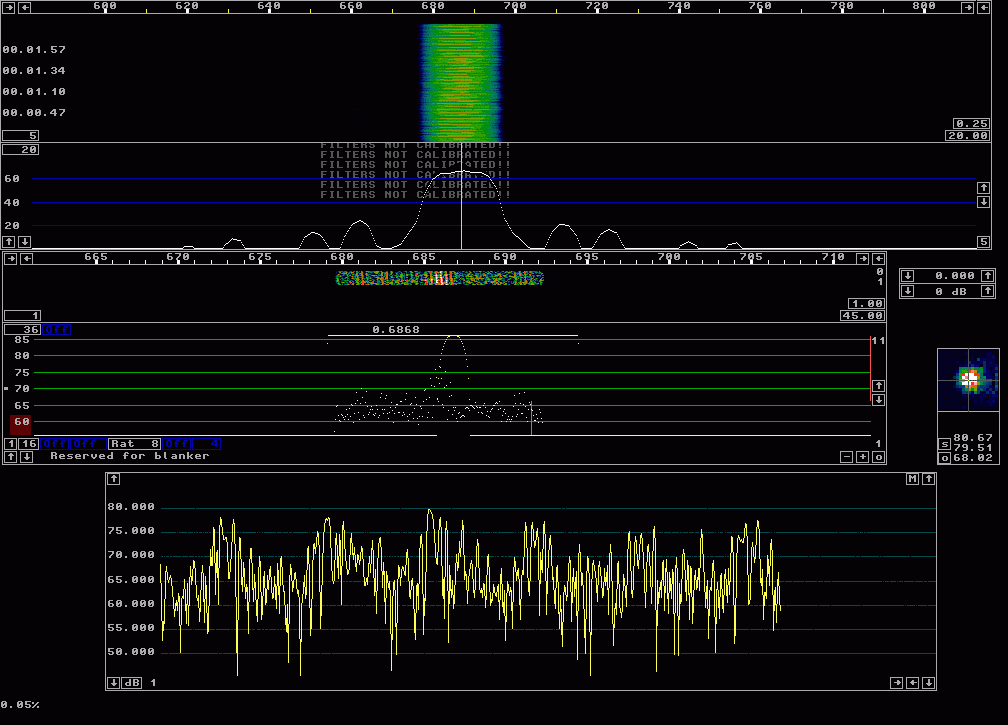
Fig 5.The loudspeaker output from figure 4, l.mp3 is here used as the input to Linrad. |
|
The station L-350 is peculiar in that it does not have a well defined carrier frequency for the modulation sideband. As can be seen from figure 4 and more clearly from figure 5, the carrier of L-350 is split into six carriers separated by 0.3 Hz. This is particular to L-350. Other stations typically have a well-behaved carrier. The main carrier at 350 kHz is narrow, it is the modulation tone at 1056 (nominal 1020) that has an odd frequency spectrum. Presumably because the phase of the modulation tone is not continuous between dots and dashes. Linrad has a mode Coh2 where the carrier is extracted by use of a narrow filter. The phase is then used in a quadrature mixer to produce two channels I and Q. I will correspond to AM modulation and should contain the signal for on-off keyed signals while Q should contain the phase modulation which should be noise only. Figure 6 shows the Linrad screen when processing L-350 in Coh2 mode. The loudspeaker output lc.mp3 (914760 bytes) is two channels and should be listened to in stereo head-phones. When this file is used as the input to Linrad as two channels, the screen looks like figure 7. |
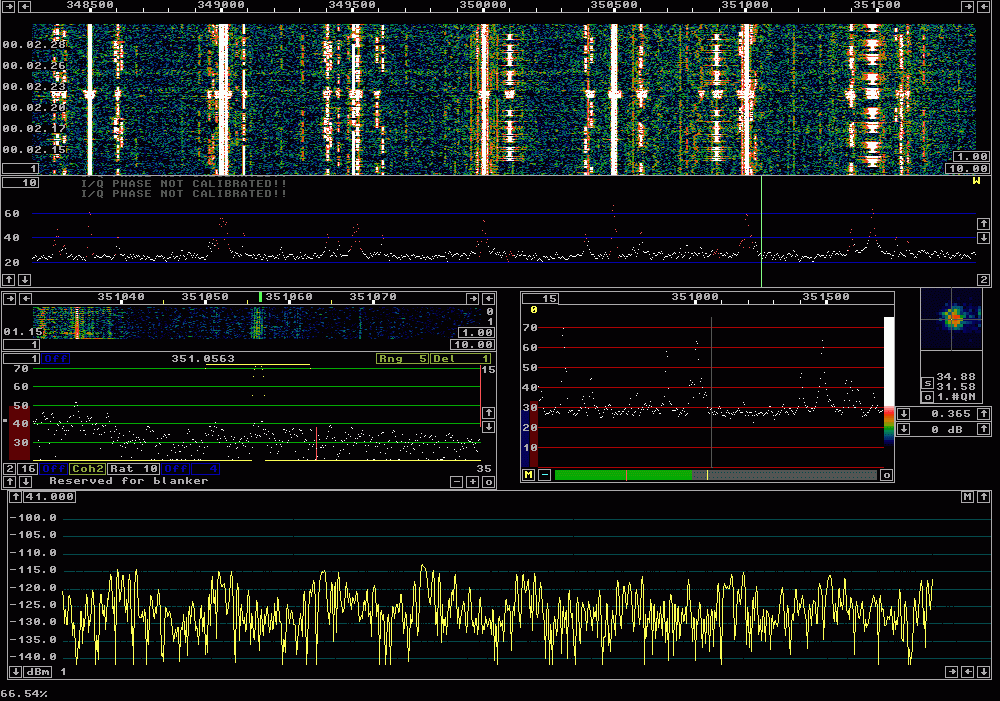
Fig 6. L on 351.056 kHz in Coh2 mode. |
|
|
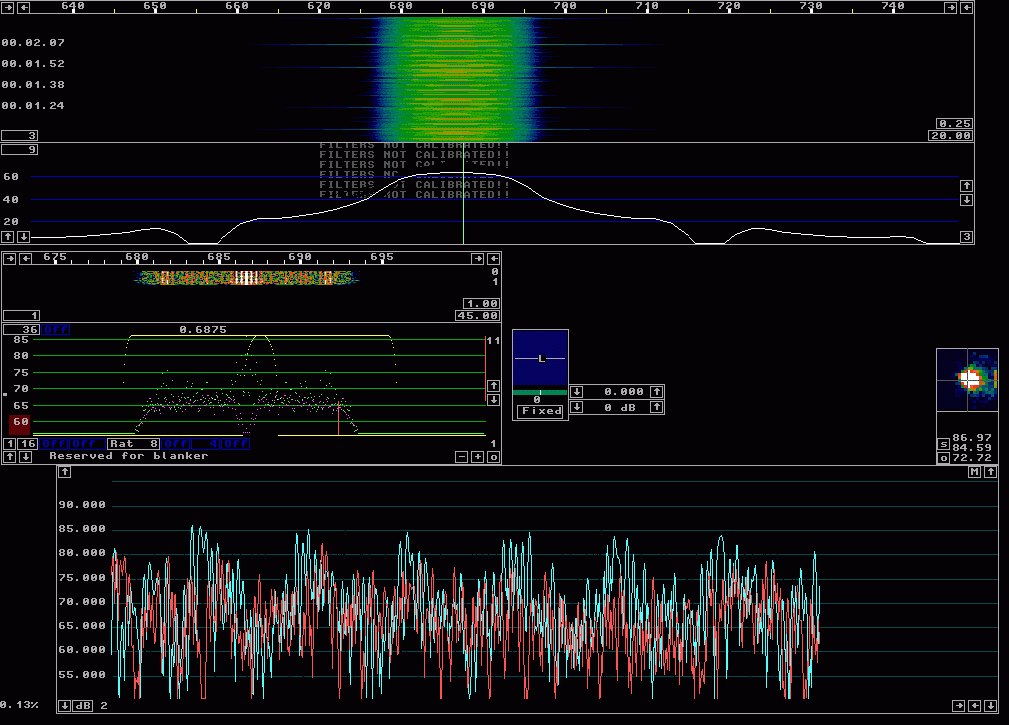
Fig 7.The loudspeaker output from figure 6, lc.mp3 is here used as the input to Linrad. |
|
An inspection of figure 7 shows that the blue trace, thew Q signal, in the S-meter graph contains very little signal but that its power level is the same as the red trace, the I signal. The RMS noise floor is at about 68 dB in both curves. The signal, the Morse coded L is at about 84 dB for a S/N ratio of about 16dB in figure 7. (For someone listening to the left channel only.) In figure 5, the noise floor is at about 65 dB while the signal is at about 78 dB for a S/N ratio of 13 dB. The Coh2 mode may improve S/N by 3 dB for someone listening to the left channel only. It may be a good idea to listen to both channels with stereo head-phones. That would degrade the improvement to about 2 dB but then the signal would not be lost if the phase of the carrier becomes incorrect. Carrier bandwidths.Figure 8 shows JX-349 from Vaexjoe, Sweden, 948 km, on 349.402 kHz. This station has a narrow carrier on its sideband unlike L-350. The station below, TAR-349, on 349.393, a military NDB from Orland/Tarva, Norway, 1415 km, has a very wide carrier while OYE-349, Paris/Orly, France, at 315 km on 349.413 with the code has a very narrow carrier. |
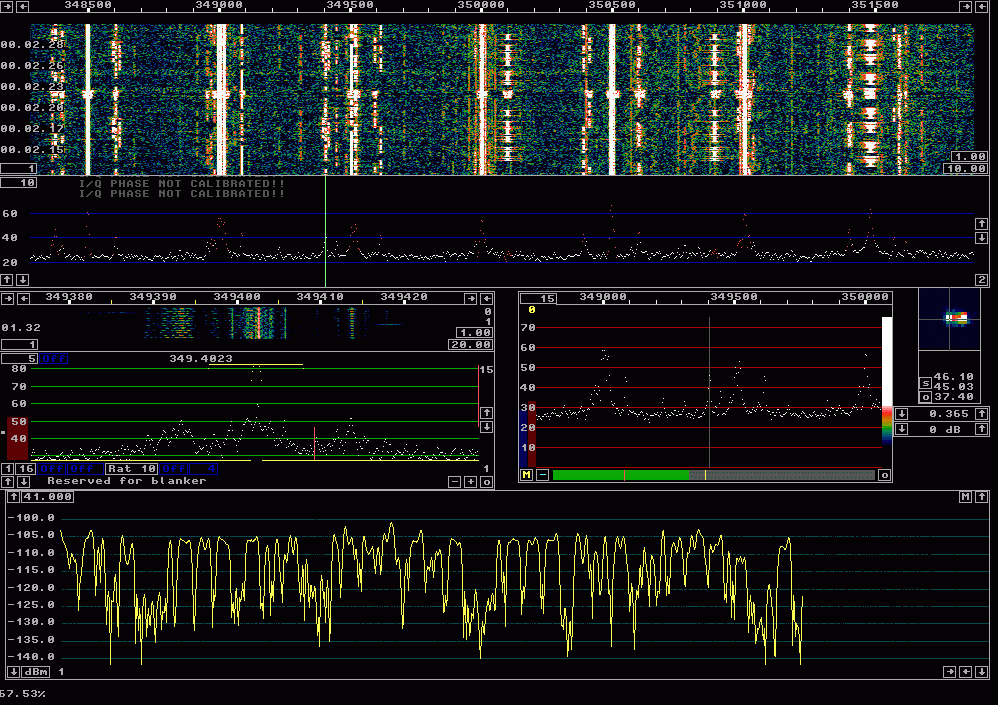
Fig 8.The station wwwwwwwwwwwwwwwww on 349.402. |
|
The carrier bandwidth of the A1 Morse coded sidebands may be affected by the stability of the tone modulated carrier, the stability of the modulation tone and by path modulation due to ionospheric effects. Figure 9 shows the primary carriers around 350 kHz. It is obvious that they are very narrow and therefore one can conclude that the reason for spectral broadening is in the phase stability of the modulation tone. Presumably the phase is not continuous between the Morse code parts. |

Fig 9.Carriers near 350.000 kHz. |
|
To SM 5 BSZ Main Page |