
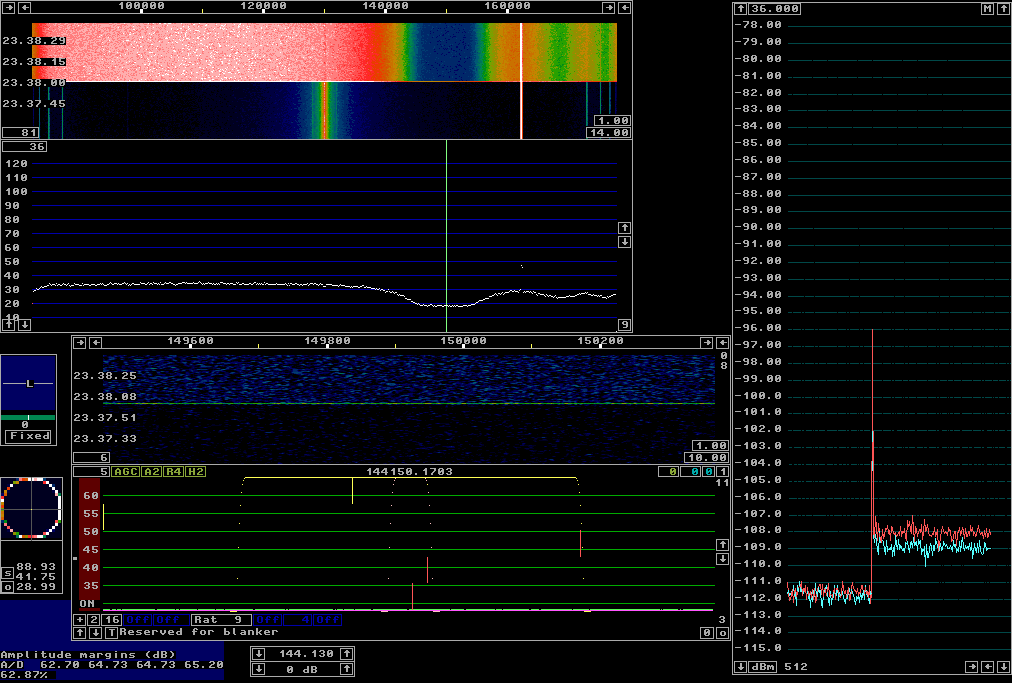
Introduction.The IQ+ receiver is a direct conversion two channel receiver that produces four audio channels and has to be used together with a four channel soundcard. It can be used as a direct replacement for the WSE converter chain. Unless otherwise noted the tests are made in a 650 MHz Pentium III cumputer under Windows XP with an unmodified Delta 44.Reciprocal mixing and blocking.Figure 1 shows the dynamic range. Here a signal about 1 dB from A/D saturation is switched on and then stepped in steps of 10 kHz until the passband center is reached. The signal as well as the noise floor in a bandwidth of 500 Hz can be read directly from the S-meter graph where the signal is placed at zero on the dBm scale. The point of saturation is -25 dBm at the IQ+ antenna input. |

|
Fig. 1.Dynamic range of the IQ+ with a Delta 44 soundcard.
The noise floor close to a strong signal.
The signal level is -34 dBm and the dynamic range(500Hz)
is above 100 dB already at a frequency separation of 10 kHz.
Separation     Level        Level
  (kHz)      (dB/500Hz)    (dBc/Hz)
    0           0             0
   10          -102.6       -129.6
   20          -104.1       -131.1
   30          -104.8       -131.8
   40          -105.0       -132.0
   50          -105.2       -132.2
  off          -111.7          -
|
|
At close range most VHF receivers are limited by reciprocal mixing. The IQ+ is no exception. At 20 kHz the IQ+ is more than 10 dB better than conventional receivers such as IC706MKIIG and FT817 in reciprocal mixing performance because the low phase noise of the Si570BBB. At 50 kHz the phase noise of the LO lifts the noise floor by 7.5 dB at the point of saturation. The sideband noise of the LO is -133 dBc/Hz. The levels obtained from figure 1 is the sum of all noise contributions and since the amplifier noise is about 7 dB below the sum of amplifier noise and reciprocal mixing noise, the phase noise of the LO is 1 dB below the sum. The effect of a single strong interfering signal at large frequency separations is shown in table 1. Here a modest signal at 144.162 is injected together with a strong signal at different frequency separations. A notch filter with a 60 dB deep notch at 144.150 is inserted in the signal path to eliminate the sideband noise from the HP8657A signal generator used for the strong signal. The noise figure of the IQ+ is 9 dB which means that the noise floor is at -165 dBm/Hz. MDS (minimum discerneable signal) as defined by ARRL is -138 dBm (the noise in a bandwidth of 500 Hz.) A large fraction of the noise comes from the Delta44 as it should. Near the center frequency the noise figure is higher. at +/- 5 kHz it is about 11 dB. The A/D converter in the soundcard is the weakest point in a real system where a low noise amplifier with perhaps 16 dB gain is used at the antenna. The low reciprocal mixing noise would be masked by the LNA noise. The level at which the IQ+ is blocked differs by about 3 dB between the channels at 5MHz separation due to a small difference in filter tuning. The average between the channels is listed in table 1 but the difference between the channels is very small excepot at 5 MHz separation. |
Separation      1 dB compression               3 dB noise increase
   (MHz)        (dBm) (dB/Hz)(dB/500Hz)         (dBm)(dB/Hz)(dB/500Hz)
    0.1         -18     147     120              -30    135     108
    0.5          -7     158     131              -25    140     113
     1           -7     158     131              -20    145     118
     2           -7     158     131              -16    149     122
     5           +1     168     141               -9    156     129
     7          >+6    >171    >144               +3    168     141
Table 1. The dynamic range of IQ+.
Above about 5 MHz from the center frequency the 144 MHz filters
provide selectivity.
|
|
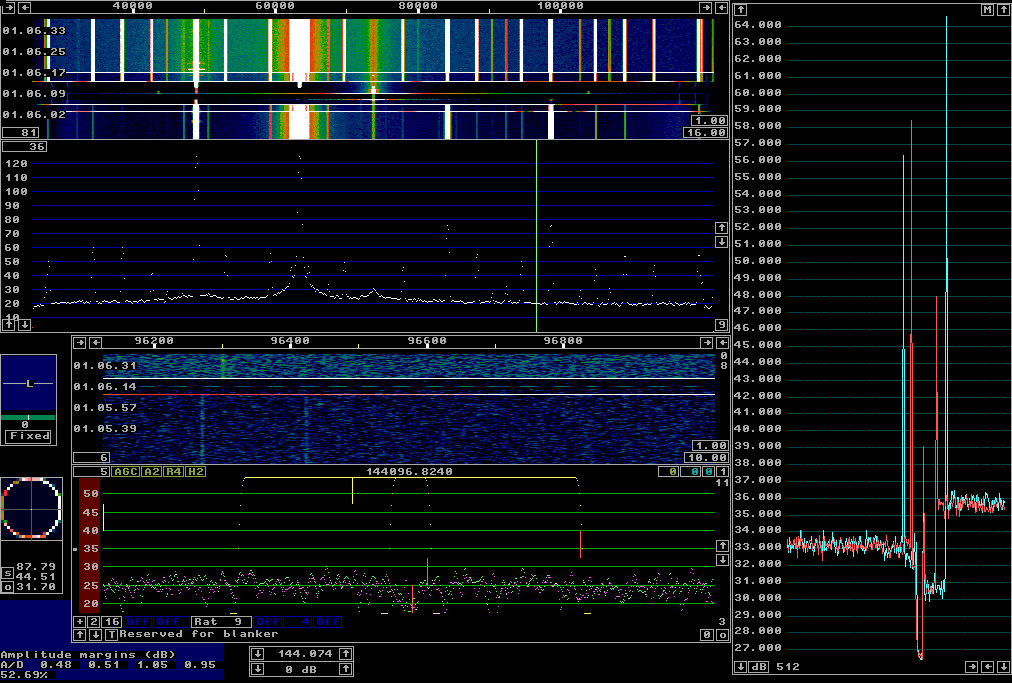
Figure 2 shows the screen with +3 dBm at a frequency separation of 7 MHz. The noise within the notch lifts by 3 dB while the noise outside lifts by about 18 dB. That is because the HP8657A has a sideband noise around -150 dBc/Hz at 7 MHz separation. Within the notch the noise lifts due to reciprocal mixing. |
|
| Fig. 2. +3 dBm injected at a frequency separation of 7 MHz. The noise floor in the IQ+ is lifted by 3 dB which is only visible inside the notch. Outside the notch the phase noise of the HP8657A is about 18 dB above the noise floor of the IQ+. The test setup can not deliver more than +6 dBm degradation can not be observer at larger separations without more power. |
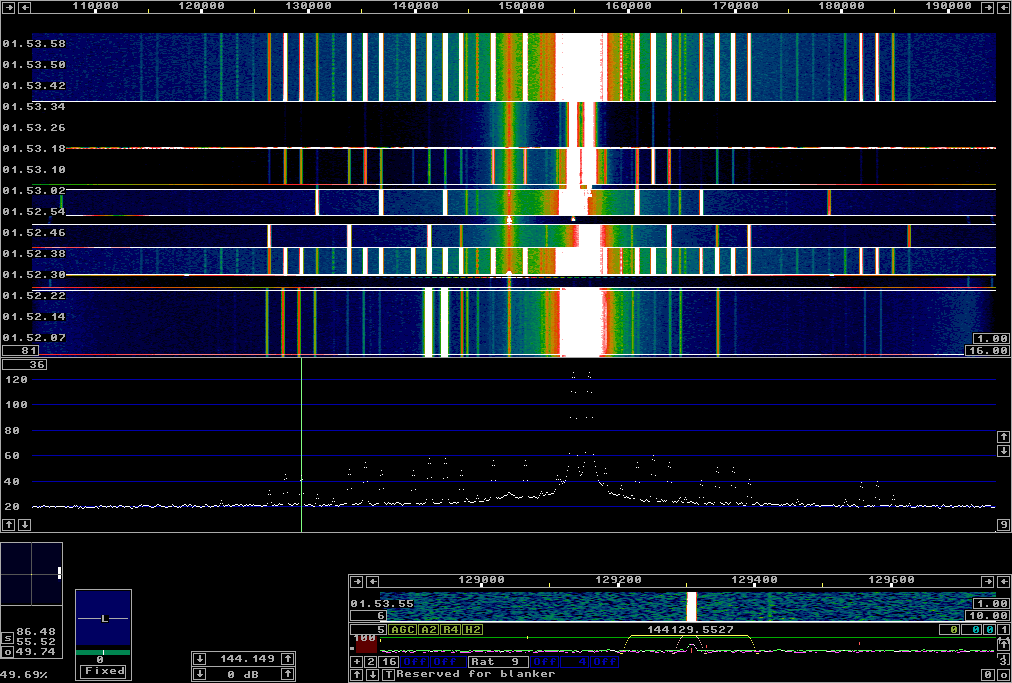
Two tone test.A two-tone test with the IQ+ is non-trivial. Standard instruments like the HP8657A are not quite good enough. Figure 3 shows the screen with a crystal oscillator and a HP8657A. |
|
| Fig. 3. Two signals, -32 dBm each injected into the IQ+. The lower half of the waterfall shows how the same situation looks with the WSE converters. No settings are changed, only the two RF cables and the audio cable is shifted from the WSE system to the IQ+. The lower screen is intended to show that the test signal is adequate. The WSE system is not designed for consumer gain. |
|
The third order intermodulation is at 60 and 47 dB in figure 3 while the signals are at 124 dB. From those levels one can estimate the input IP3 to be about -32 + (124-58)/2 = 1 dBm for the IQ+ at close range. Several things are obvious from figure 3.
|
|
|
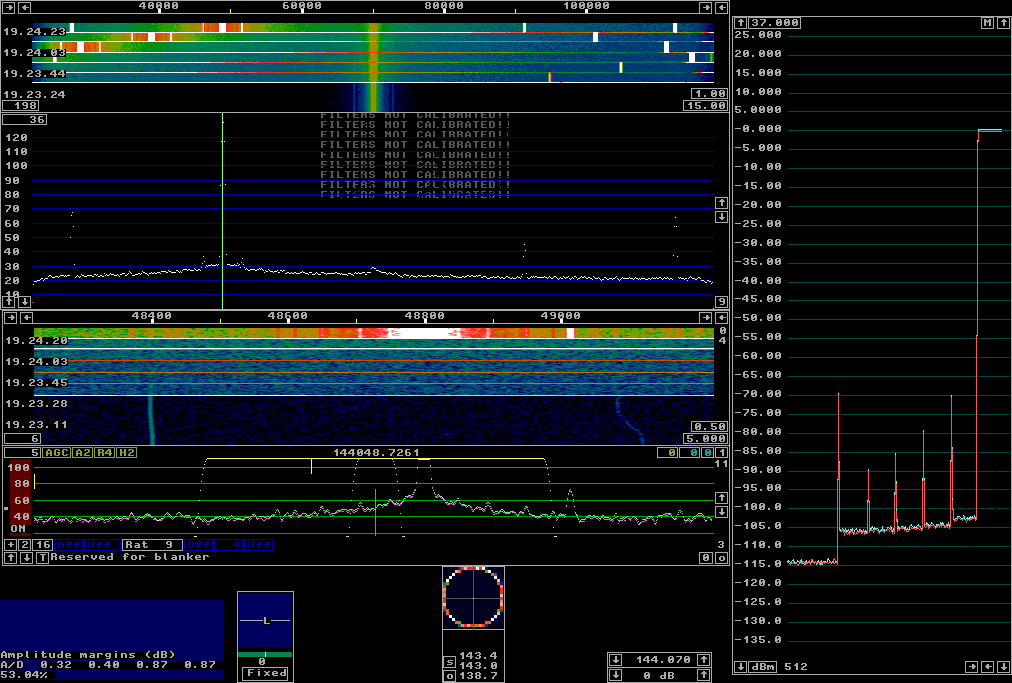
Fig. 4. From bottom:
Two signals -32 dBm WSE. Two signals -32 dBm IQ+. One signal at -32 dBm IQ+. The other signal at -32 dBm IQ+. Two signals -42 dBm IQ+. Two signals -52 dBm IQ+. Two signals -32 dBm IQ+. (Also seen in the main spectrum) |
|
|
   RF        AF     Description      Order                       Level
  (MHz)                                    (dB/-32dBm)   (dB/-42dBm)   (dB/-52dBm)
144.1548    600          F1         1st        135           125           115
144.1563    750          F2         1st        135           125           115
144.1428    600        F1 Img       1st         68            42            27
144.1413    750        F2 Img       1st         68            41            26
144.1533    450        2*F1-F2      3rd         54            36             -
144.1578    900        2*F2-F1      3rd         60            40             -
144.1443    450      2*F1-F2 Img    3rd         57            32             -
144.1398    900      2*F2-F1 Img    3rd         58            29             -
144.1473    150         F1-F2       2nd         66            46            26
144.1503    150         F2-F1       2nd         66            46            26
144.1608   1200         2*F1        2nd         64            44            24
144.1623   1350        F1+F2        2nd         70            50            30
144.1638   1500         2*F2        2nd         64            44            24
144.1368   1200       2*F1 Img      2nd         59            38            18
144.1353   1350        F1+F2 Img    2nd         65            44            24
144.1338   1500       2*F2 Img      2nd         59            38            18
144.1668   1800         3*F1        3rd         51            21             -
144.1683   1950       2*F1+F2       3rd         60            30             -
144.1698   2100       F1+2*F2       3rd         61            31             -
144.1713   2250         3*F2        3rd         51            22             -
144.1308   1800       3*F1 Img      3rd         39            27             -
144.1293   1950     2*F1+F2 Img     3rd         54            39             -
144.1278   2100     F1+2*F2 Img     3rd         55            40             -
144.1263   2250       3*F2 Img      3rd         42            28             -
144.1803   3150       4*F1+F2       5th         34             -             -
144.1818   3300      3*F1+2*F2      5th         49            22             -
144.1833   3450      2*F1+3*F2      5th         50            22             -
144.1848   3600       F1+4*F2       5th         39             -             -
Table 2. Audio overtones and audio intermodulation in the IQ+. The ordinary RF IM3 coincides with the audio IM3. From the levels with -42 dBm input one can estimate IP3 to be (125-39)/2-42=1 dBm in agreement with the conclusion from figure 3. Note that overtones and intermodulation products do not have the ordinary I/Q phase relation so Img does not have the usual meaning, here it is just a notation that it is the second occurance of an audio signal. |
|
Second order products 69 to 76 dB below the signals at an input level
of -32 dBm so they correspond to signals at -101 to -108 dBm.
The noise floor (MDS) is at -138 dBm so these signals will be 30 to 37 dB
above the noise floor on the IQ+ itself, reciprocal mixing not taken
into account.
In a real application a mast mounted LNA would lift the noise floor by
about 16 dB and therefore the strongest second order products will
be 14 to 31 dB above the noise in a 500 Hz bandwidth.
With signals 10 dB below A/D saturation the close range intermodulation
and intermodulation is insignificant and all but one of the second
order products visible in figure 4 and listed table 2 are harmless.
All but one of them disappear if the strong signal(s) are placed well away
from the center frequency or on the center frequency.
The lowest part of the waterfall in figure 4 shows that the audio
distortion is created in the IQ+ and not in the Delta 44 soundcard.
The only harmful second order product is the audio difference frequency. The reason is that signals well outside the visible window can have a small frequency separation and create difference signals inside the desired frequency range. Table 3 lists the signal level needed to make the difference signal equal to MDS, the noise floor in 500 Hz bandwidth. The table also lists the associated 2nd order IMD dynamic range. br> |
Separation         Level          Dynamic range
  (MHz)            (dBm)            (dB/500Hz)
    1               -50                88
    2               -49                89
    5               -42                96
    7               -32               106
   10               -19               119
   15                -6               132
   18                +1               139
Table 3. The difference signal that occurs when
two close spaced signals are present at different frequency
separations between the signal pair and the center frequency.
Level is the level for each tone at the point where the difference
signal is equal to -138 dBm.
|
|
The mechanism that produces the difference frequency at the
levels listed in table 3 will demodulate AM and some types of
digital modulation and place the demodulated signal at the center
frequency.
In case the difference signal presents problems,
a filter should be inserted in front of the IQ+.
Good suppression at 1 MHz separation is trivial on 144 MHz
and cavities can be made much narrower if required.
Besides preventing the difference frequency which probably best can be described as AM detection in the mixer chip filters may be useful to suppress wideband third order intermodulation. Table 4 gives the signal level required to make the third order intermodulation equal to MDS, the noise level within a 500 Hz wide passband, -138 dBm. The table also gives the associated IM3 dynamic range and third order intercept point. |
Separation      Level     Dynamic range      IP3
  (MHz)         (dBm)      (dB/500Hz)       (dBm)
   0.1           -49           89            -4
   0.5           -42           96            +6
    1            -40           98            +9
    2            -37          101           +13
    5            -24          114           +33
   10            -19          119           +40
Table 3. Wide range third order intermodulation.
Level is the level of each one of the two tones that
create a 3rd order intermodulation product equal to -138 dBm.
IP3 is a little worse than the +1 dBm found at close range.
That is probably caused by audio intermodulation which is
likely to increase with frequency.
At larger frequency separations IP3 improves because of the filters.
|
The signal levels where third order intermodulation might cause problems
are similar to the signal levels where the difference frequency
might cause a problem.
Only very high signal levels will cause problems and both IM2 and IM3
can be eliminated by suitable filters on 144 MHz.
Soundcards.The IQ+ performance reported above is to some extent limited by the performance of the soundcard. The Delta 44 is an old design now (2012) and modern soundcards might be quite a bit better. The modified Delta 44 soundcard. was further modified with the 6.8 k resistors in the input voltage dividers replaced by 2.2 k resistors. The board then has the same sensitivity in the +4dBm setting as the original design has in the consumer gain setting. The noise is however significantly lower. Figure 5 is the same test as figure 1 with the only difference that the soundcard is better. The noise floor is 2.5 dB lower but since measurements were made with steps in integer dBs that difference is not an accurate figure for the improvement. A NF test shows that the NF is improved by about 1.5 dB so that is the dynamic range improvement. The levels for reciprocal mixing are accurate however. They are measured relative to the carrier both in gigure 1 and figure 5. |
|
Fig. 5.Dynamic range of the IQ+ with a modified Delta 44 soundcard.
The noise floor close to a strong signal.
The signal level is -34 dBm and the dynamic range(500Hz)
is above 100 dB already at a frequency separation of 10 kHz.
Separation     Level        Level
  (kHz)      (dB/500Hz)    (dBc/Hz)
    0           0             0
   10          -102.6       -129.6
   20          -104.5       -131.5
   30          -105.1       -132.1
   40          -105.5       -132.5
   50          -106.0       -133.0
  off          -114.2          -
|
|
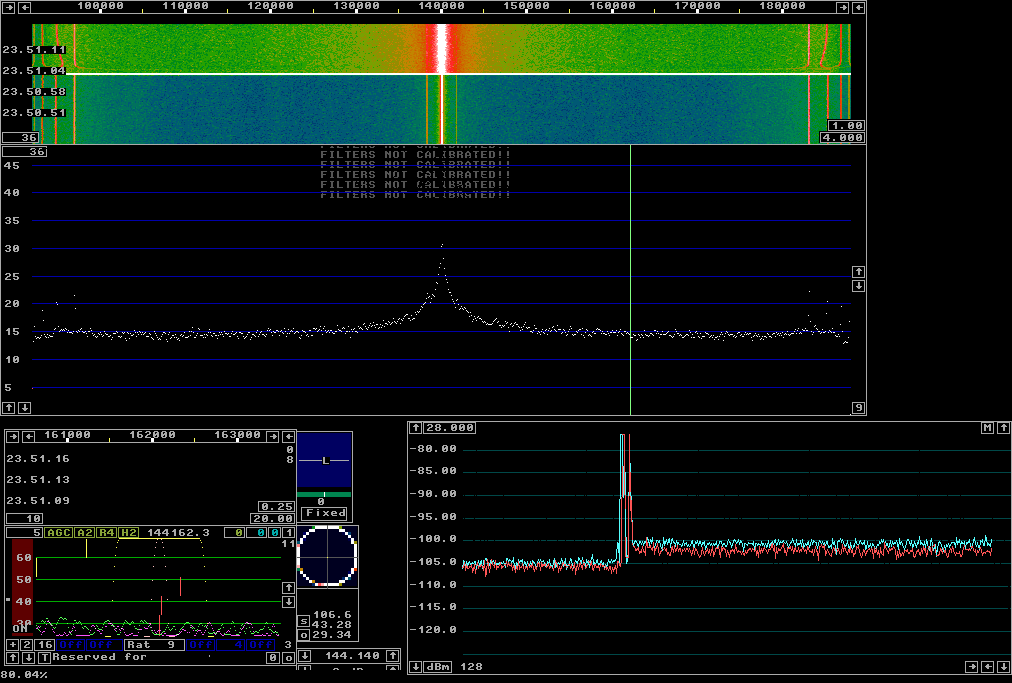
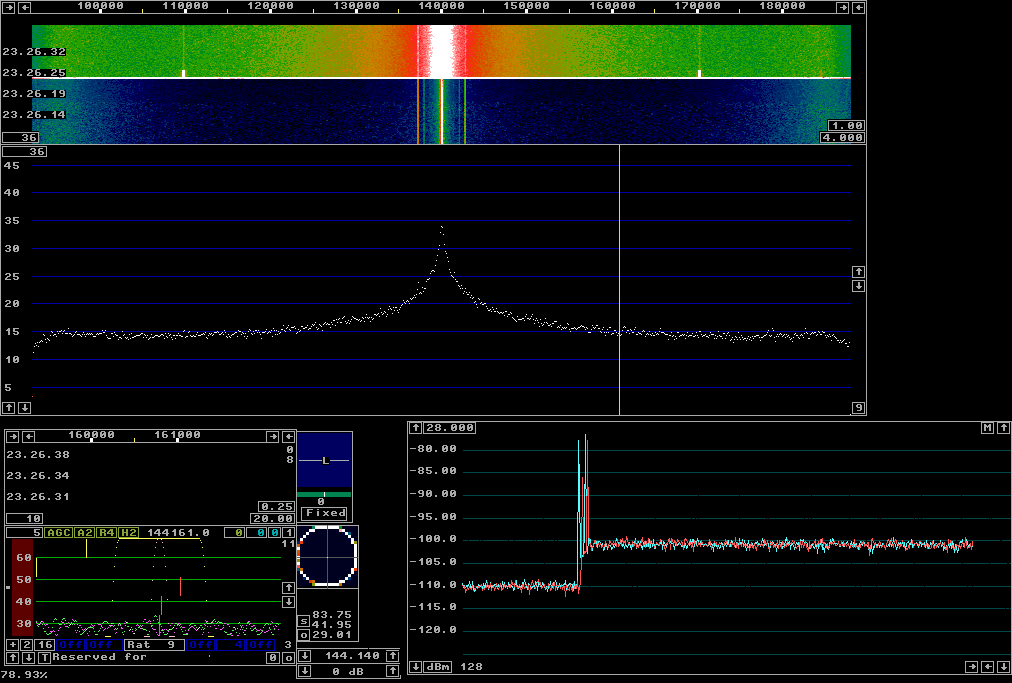
Figures 6 and 7 show the noise decrease when the cable is unplugged from the Delta44 soundcard. This is a simple test by which one can verify that the noise from the IQ+ is at a suitable level above the noise from the soundcard. |
|
| Fig. 6. The IQ+ unplugged from a unmodified Delta 44 set to consumer mode. The computer is a 650 MHz Pentium III. |
|
|
|
| Fig. 7. The IQ+ unplugged from a modified Delta 44 set to +4dBu mode. The computer is a 650 MHz Pentium III. |
|
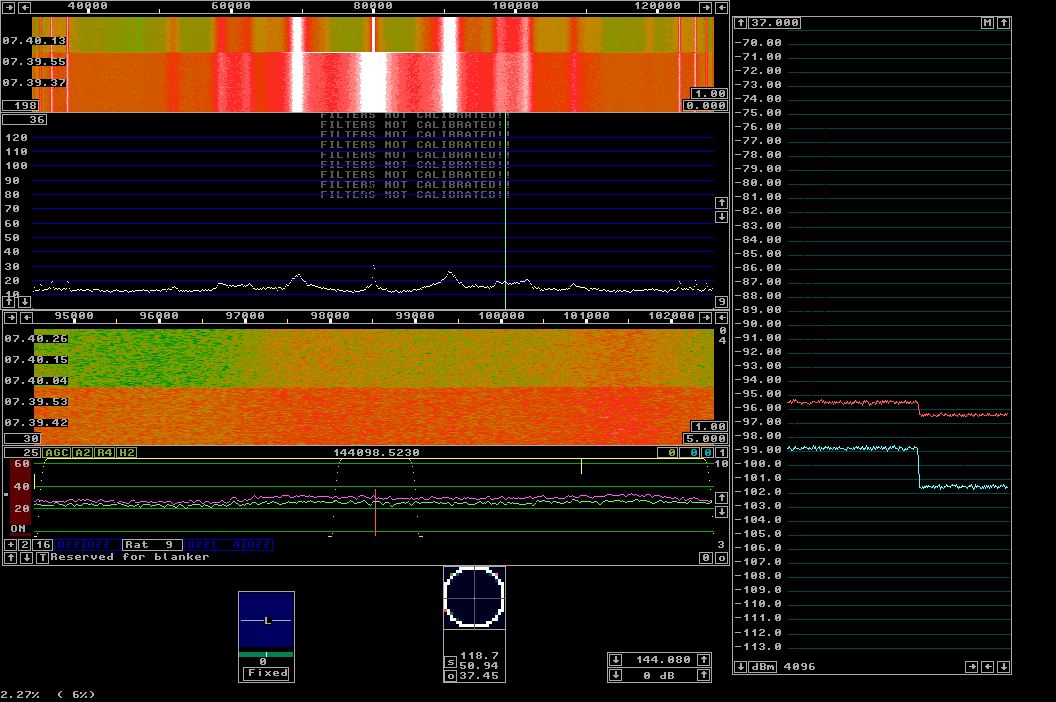
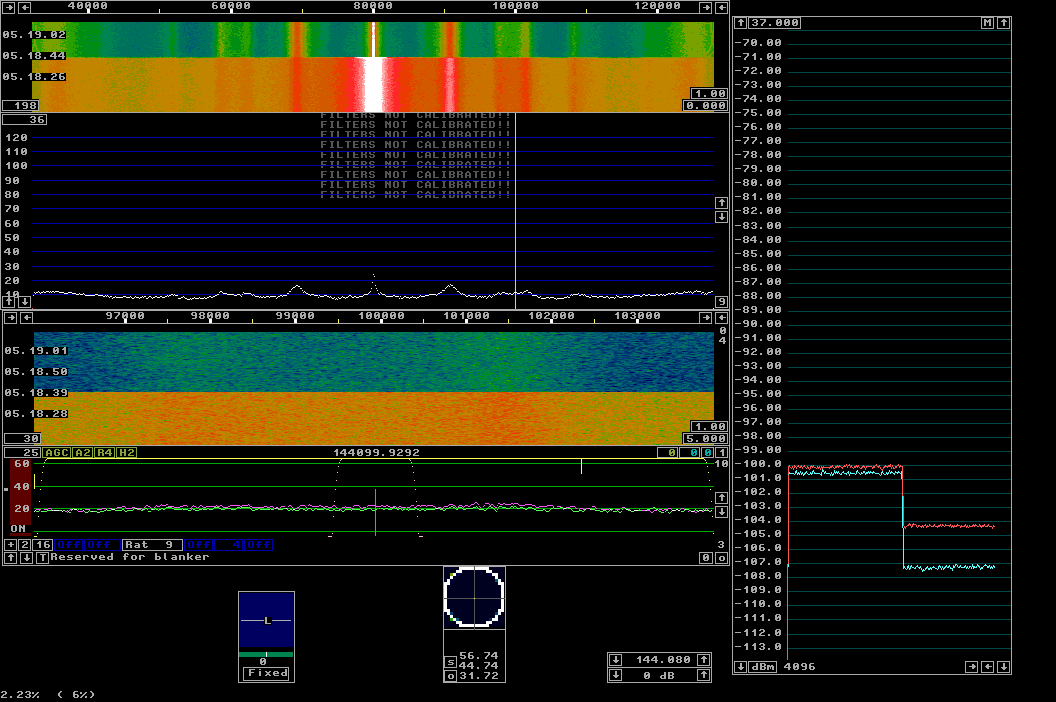
It is clear from figures 6 and 7 that the modification improves the noise floor of the Delta 44 by about 5 dB but the improvement at the antenna input of the IQ+ is only 1.5 dB because most of the noise is from the IQ+. The soundcard test unplug the soundcard is also a test of the computer. Figures 8 and 9 show the same thing as figures 6 and 7 but with the soundcards in another computer, a D5400XS with two Xeon E5410 CPUs and 8 cores. It is obvious that performance is significantly degraded. The problem is probably HF interference. Sampling is at 64 times the nominal sampling frequency and the A/D converter is probably not adequately protected from RF. The simple test: unplug the soundcard will show if the noise floor falls by at least 3 dB for all frequencies of interest. It is obvious from figure 8 that the Delta 44 fails this test when used on the D5400XS motherboard if the Delta 44 is used without modifications. It is also obvious from figure 9 that the Delta 44 would need some more modification to work really well in the D5400XS computer. |
|
| Fig. 8. The IQ+ unplugged from a unmodified Delta 44 set to consumer mode. The computer is a D5400XS with two Xeon E5410 CPUs. |
|
|
|
| Fig. 9. The IQ+ unplugged from a modified Delta 44 set to +4dBu mode. The computer is a D5400XS with two Xeon E5410 CPUs. |
|
|