AFC control.The buttons are placed at the bottom of the AFC graph. Numbered from left to right they are:1. Mode control
Select mode '-' 'A' or 'M' for 'off', Auto' or 'Man'.
The control bars are:
Blue S/N limit.
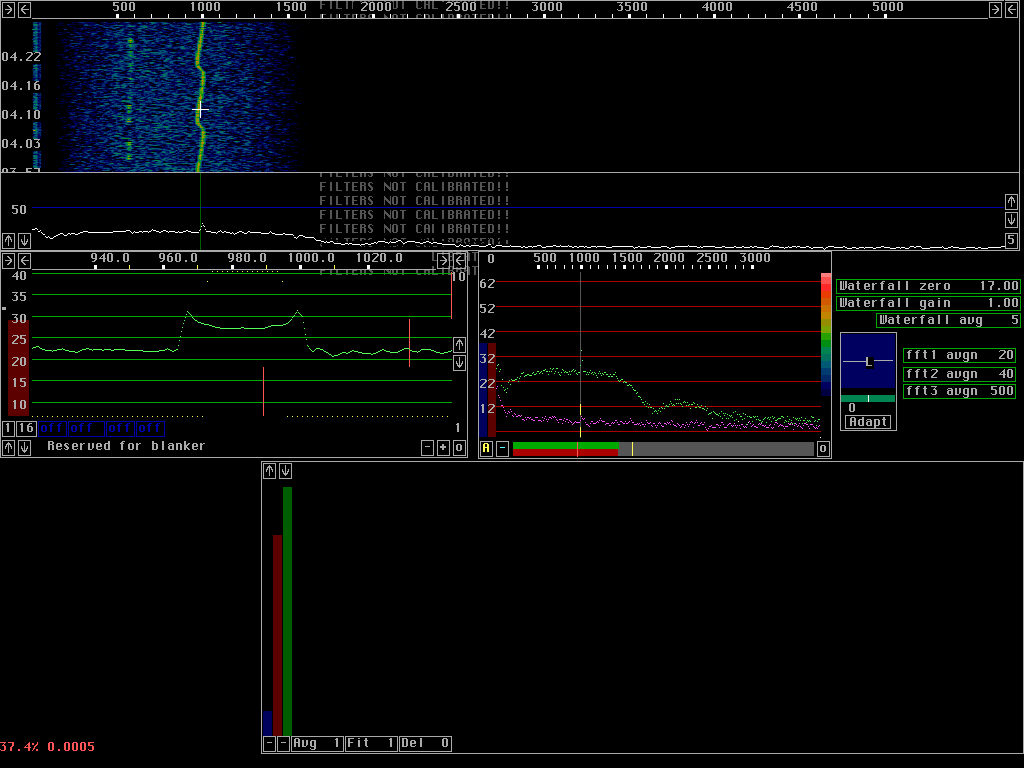
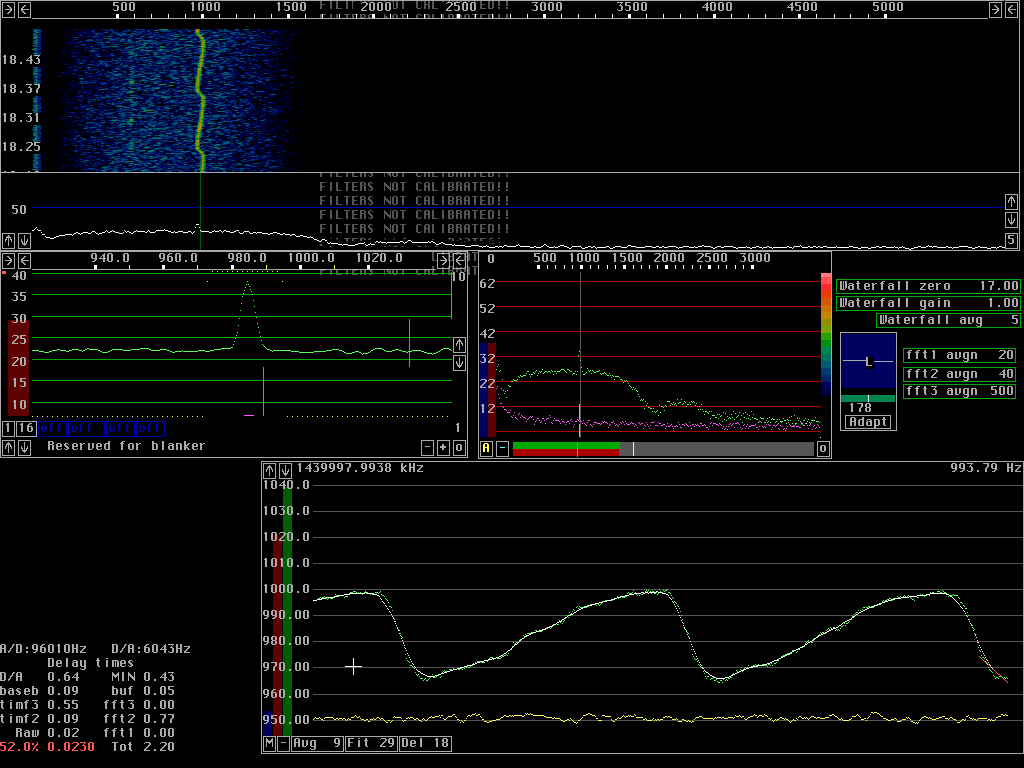
Test signalTo demonstrate how the AFC works a frequency modulated signal was used. Some noise was added and the same signal and S/N was used for all images on this page. To make the effects easily visible a relatively large bandwidth was selected for the fft. Both the first and second fft operate at a bandwidth of about 10Hz. The sampling speed was 96kHz and the transform size 8192 corresponding to 5.8Hz per data point. A sin squared window was used.The AFC can be disabled. This is useful in order to quickly remove the time delay associated with the AFC when listening to signals that do not require the AFC. Figure 1 shows the test signal without AFC. The baseband graph (green dB scale) shows the long time integrated spectrum of the baseband signal. The signal is smeared out over about 35Hz.
|
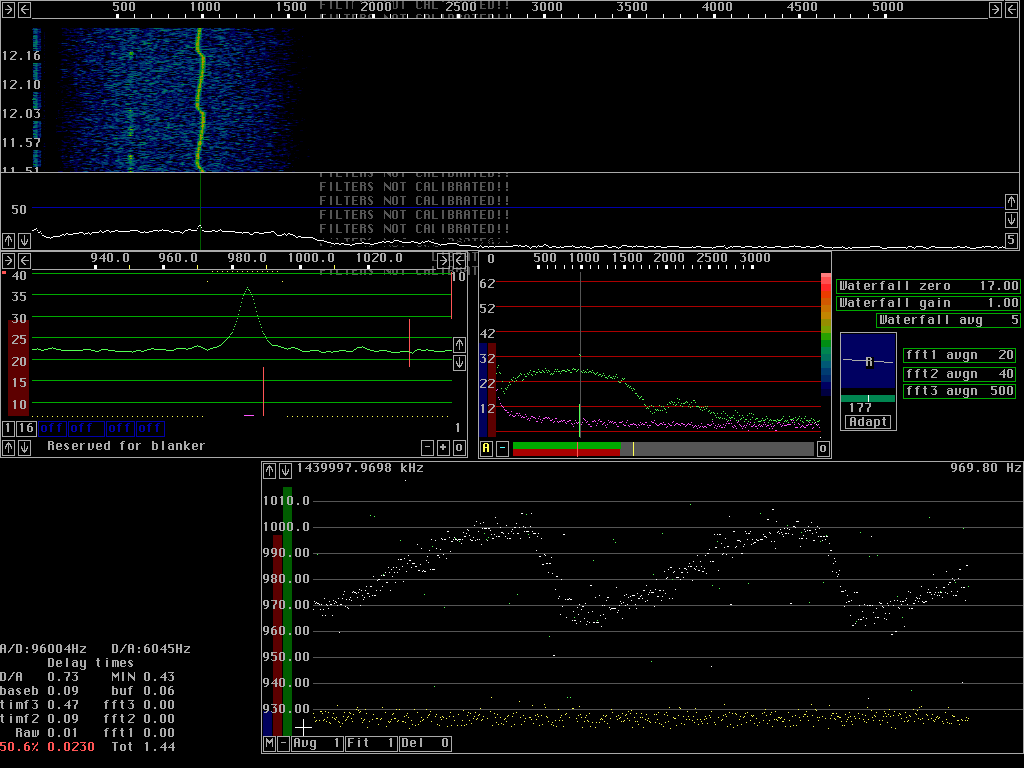
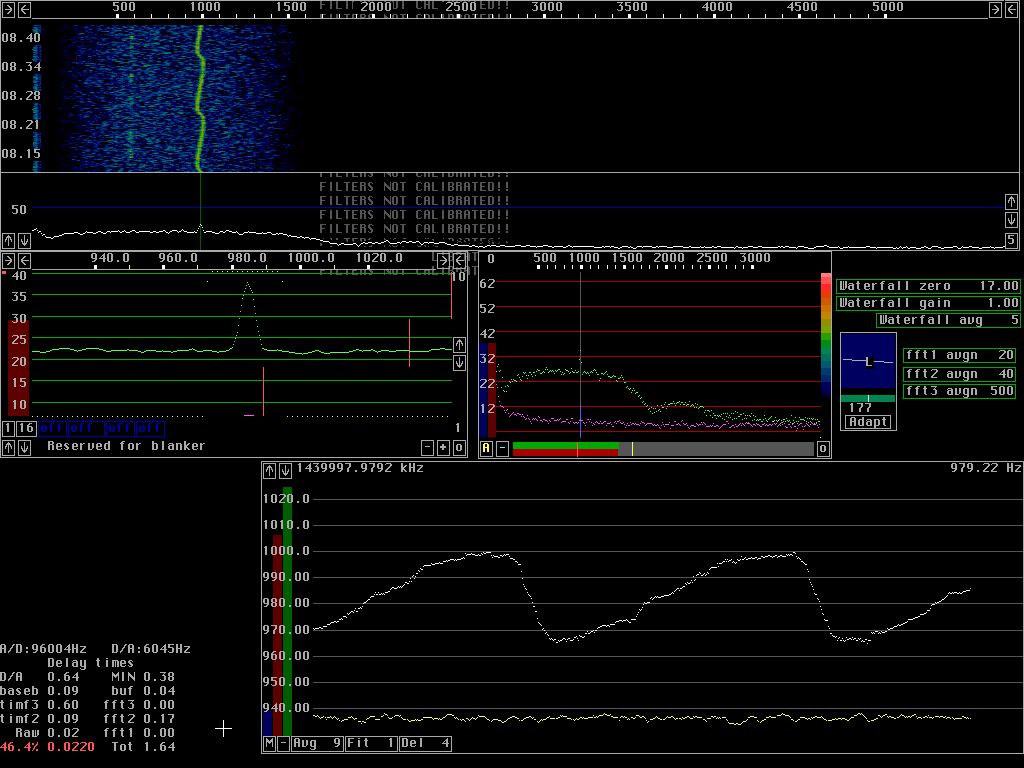
Averaging over transformsThe frequency can be determined from a single transform only if S/N is above a certain level. For low S/N ratios the frequency becomes less accurate. Fig 2 shows the AFC running without averaging and without fitting a straight line to frequency values. In other words: The signal, which is obtained by a back transform from fourier transforms, is converted to the baseband by use of the frequency determined from the particular transform that is being back transformed only.The test signal has an S/N of about 10dB in the second fft transforms used for the AFC. The AFC graph shows frequency on the vertical axis and time on the horisontal. As can be seen from fig. 2. the frequency error is about 2Hz RMS. The blue control bar for S/N is set at a level where some transforms are not accepted as good enough. Note that some white points form small horisontal lines among the scattered data points. Compare fig.2 to fig. 3 in which each frequency value is determined from the average of 9 transforms. Averaging means improving S/N by the square root of the number of transforms averaged over if the signal amplitude is constant Note that the frequency error is much smaller. Also note that the average spectrum in the baseband graph is narrower in fig. 3. The frequency determined from averages over transforms is closer to the true frequency of the test signal. Fig 4 shows what can be done if a faster response is desired. Here an average over 9 transforms is also used, but the transforms are not surrounding the one containing the current signal. This means that the frequency used for back transformation is the frequency that would have been appropriate 4 transforms earlier.
|
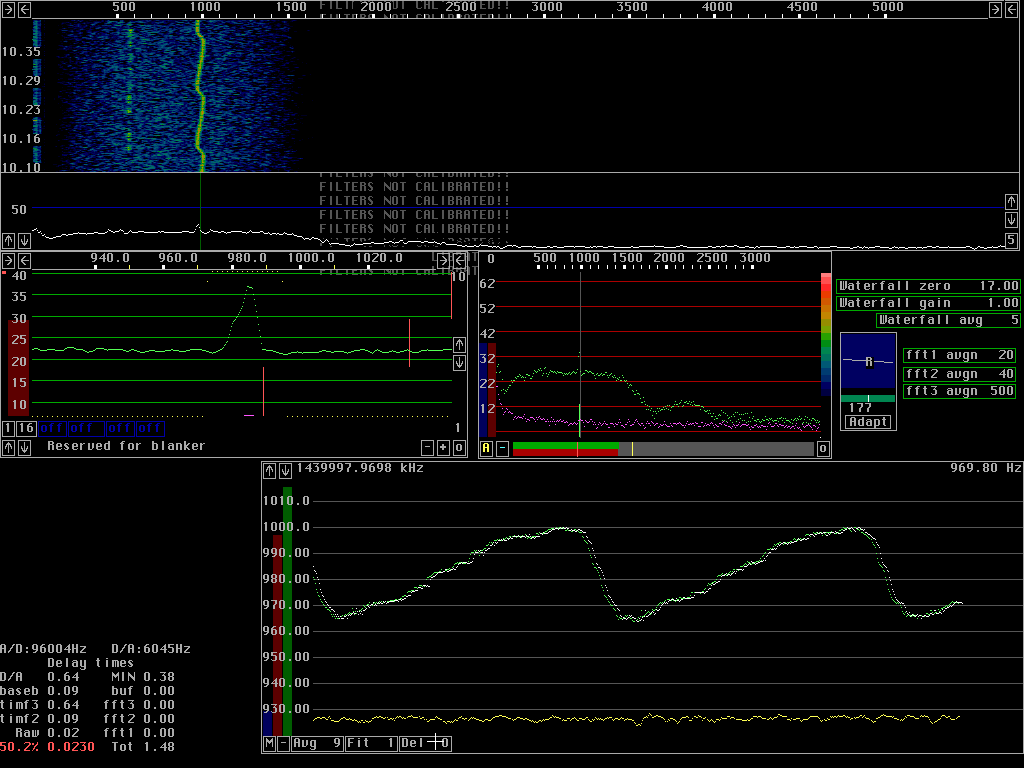
Line fittingThere is a limit for how much the S/N ratio can be improved by transform averaging. The signal must not drift by more than 1 fft bin over the entire time span over which averaging is made.Linrad can fit an S/N weighted straight line to the frequencies determined from the transforms. The best estimate of the true frequency is obtained if the midpoint of the fitted line is used. It is possible to use a smaller delay but then the frequency determination becomes less good. Figures 5 and 6 show full operation of the AFC. The green dots are frequency values determined from the average of 9 transforms. The yellow points are the corresponding S/N ratios in dB. The red line to the right in the graphs is a straight line that is fitted to the S/N weighted frequency values. The most recent frequency value corresponds to 4 transforms back in time. The red line is extrapolated up to present time. Fig 5 gives a much more accurate frequency but it ia also associated with a time delay. The accuracy required for the AFC depends on the operation mode. For a normal CW signal there is no reason to have the frequency better than within 1Hz. To accomodate the signal one then has to open the bandwidth by about 10% which will not affect readability much. If coherent processing is used, the frequency has to be determined well enough to not degrade the coherence time of the signal. For coherent processing it is possible to use very long processing delays to allow accurate enough frequency determination of extremely weak signals to perform coherent averaging.
|

| To SM 5 BSZ Main Page |