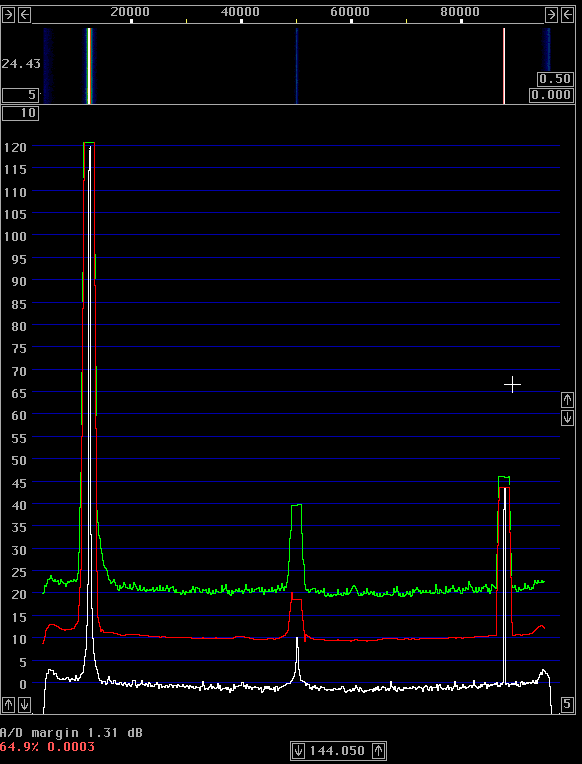
Fig. 1. Linrad and WSE converters in "Tx test mode" with a good crystal oscillator used as the transmitter under test.
Setup to measure transmitter spectral purityThese measurements were made with Linrad running on a PentiumIII 600MHz computer with a modified Delta44 soundcard. The 14 MHz signals were converted to audio by use of the WSE converters RXHFA, RX70, RX10700 and RX2500. The RXHFA unit was an early prototype, the others were regular production units.The measurement system has much better dynamic range than required for these measurements so no corrections have to be made for the noise contribution from the measurement system. The unit under test was connected to a 20dB 100W attenuator followed by an ordinary step attenuator which was connected to the RXHFA unit. The step attenuator was adjusted to place the signal approximately 1.5 dB below A/D saturation. The transmitter frequency was set to about 14.125 MHz and Linrad was run in the "tx test mode". My focus at this meeting was investigations of possible deviations from the "third order law" in third order intermodulation measurements. Measurements are incomplete, for example the steady carrier sideband noise is missing for many units. The screen of Linrad in tx test mode looks like figure 1 in which a good crystal oscillator is fed into the system. There are three spectra shown simultaneously. The red line is the average spectrum in a bandwidth of 2.4 kHz. Note that the noise floor is about 110 dB below the carrier. 10log(2400)=34 so this means that the noise floor is at about -144 dBc/Hz.
|

Fig. 1. Linrad and WSE converters in "Tx test mode" with a good crystal oscillator used as the transmitter under test. |
|
The white line is the average spectrum just as it would be displayed in normal operation of Linrad. Here one can see narrowband spurs. In figure 1 the white curve is about 11 dB below the red curve which means that the bandwidth is about 200 Hz in this particular measurement. The green curve is the peak power in 2.4 kHz bandwidth. For white noise, the peak to average ratio is about 11.5 dB. For a pure carrier, the peak power is equal to the average power. Note that the zero frequency spur has a much higher peak to average power ratio than 10 dB, it is the 1/f noise of the Delta44 soundcard that produces a narrowband signal with an 1/f modulation on it. The mirror image spur has a peak to average ratio of about 2 dB. This is because the image suppression depends on the phase with respect to the sampling clock. The way the mirror image is suppressed in Linrad limits the suppression to about 70 dB because of this phenomenon.
Continous carrierA screen dump from the Linrad display was saved for some of the units showing the spectrum centered 20 to 30 kHz above the carrier. To see these spectra, click on the links below:
TS450S (SM7DLK)
The spectral purity of a continuous carrier is listed in table 1. In this table spurious signals are excluded. To see the spurs, look at the spectra.
|
 Model and owner        Noise floor in -dBc/Hz
                       5kHz  10kHz  20kHz  50kHz
TS-450S (SM7DLK)      110.6  120.0  125.6  128.4
TS-2000 (SM7MMJ)      109.4  117.8  123.1  126.2
Table 1. Noise floor at different frequency separations
from a continuous carrier at 14 MHz.
The data comes from the screen dumps, use an image editor and use
the pixel positions if you want more details. |
Spectral purity of keyed CW transmissions.With the same setup as for continuous carrier some transceivers were tested during normal morse code transmissions. To see the spectra, click on the links below:
IC706MKIIG (SM7XXA)
The spectral purity of morse code transmissions is listed in table 2. In this table spurious signals are excluded. To see the spurs, look at the spectra. The unwanted emission at the sides of a keyed carrier is of two types. Noise and keying clicks. For each spectrum there is a peak to average ratio of the morse signal at the carrier frequency. The peak to average ratio at the sides is 11.5 dB larger than that ratio when there are no keying clicks. A significantly larger peak level indicates keying clicks and they are reported in dB below the carrier level (the peak power)
|
   Model and owner       Noise floor in -dBc/Hz  Keying clicks (dB in 2.4kHz)
                         5kHz 10kHz 20kHz 50kHz   5kHz 10kHz 20kHz 50kHz
IC706MKIIG (SM7XXA)     110.9 118.4 124.3 129.3     -     -     -     -
TR7A, vox on (SM5AYY)    -      -     -     -     25.0  30.8  40.5  43.3
TR7A, vox off (SM5AYY)   94.0 116.6 121.5 131.8   38.9    -     -     -
TS450S, long (SM7DLK)    -      -     -     -     48.3  57.0  62.3  68.2
TS450S, short (SM7DLK)  110.9 120.0 124.6 126.8     -     -     -     -
TS2000 (SM7MMJ)         108.8 117.8 122.8 125.9   46.7  67.9  70.7    -
Table 2. Interference at different frequency separations
during normal morse code CW transmission at 14 MHz
The keying clicks are in dB below the carrier in 2.4 kHz bandwidth.
The noise floor is in dB below the carrier while the they is down.
|
|
The TR7A gives horrible keying clicks when operated in full break in
mode, this rig has to be operated with a T/R switch.
The TS450S gives strong interference pulses now and then.
I did not take notes so I do not remember the details.
Probably there was a pulse between words where the pause was
long enough to cause switching between rx and tx.
The TS2000 has pretty strong keying clicks at 5kHz.
I have no notes whether this rig was operated in full
break in mode or not.
It was the first rig tested during the meeting and I was
unaware of the poor QSK performance of other rigs.
The TS2000 was simply "keyed".
Spectral purity of voice SSB transmissions.The transceivers were tested by monitoring the spectrum the same way as was done for CW transmissions while the owner was talking into the microphone. The spectrum was also recorded while the transmitter was on but without voice into the microphone. The FT897 produced strong wideband pulses when the ptt button was switched on/off and a spectrum showing that was also recorded. To see these spectra, click on the links below:
IC706MKIIG (SM7XXA)
The peak to average power of the transmitted signal, the average noise level at some different frequency separations and the peak power in 2.4 kHz bandwidth are given in table 3. The values are fetched from the screen dumps linked to above.
|
 Model and owner        Peak/avg  Noise floor (-dBpeak/Hz)  Splatter (dB in 2.4kHz)
                          (dB)    5kHz 10kHz 20kHz 50kHz      5kHz 10kHz 15kHz
IC706MK2G (SM7XXA)        10.0    83.2  98.2 117.5 131.2      28.0  38.3  47.4
IC706MK2G silent (SM7XXA)   -    124.9 131.2 135.6 135.9       -     -     -
FT897 100W (SM7USC)        9.6    88.2  93.5  99.4 115.0      28.0  36.1  39.9
FT897 5W (SM7USC)         13.4   103.8 113.8 118.4 119.4      34.6  47.0  55.8
FT897 ptt on/off (SM7USC)   -      -     -     -     -        19.3  38.6  44.2
TS450S proc on (SM7DLK)   11.8   100.3 116.9 127.5 130.9      38.6  57.6  65.4
TS450S proc off (SM7DLK)   8.4    99.4 116.9 127.2 130.9      38.3  58.6  67.6
TS450S silent (SM7DLK)      -    117.5 120.3 120.9 121.8       -      -     -
TS2000 (SM7MMJ)           12.8    93.8 109.4 124.6 125.9      32.4  49.8  63.5
TS2000 silent (SM7MMJ)      -    120.9 121.2 121.2 121.2       -      -     -
Table 3. Average noise and splatter (peak power) levels at different
frequency separations from SSB voice transmissions.
The noise floor is the average, to compare with CW noise floors,
degrade by the peak to average power.
See text. |
|
The TS-450S and the TS-2000 are reasonable with a splatter level that is about -65 dB at a frequency separation of 15 kHz. The other rigs do not seem to be ok to me.
Blocking dynamic rangeSensitivity and blocking dynamic range was measured for the TS-2000 and the TR7A. The BDR measurement was performed by use of a weak and a strong signal. The level of the strong signal required to degrade the S/N of the weak signal by 3 dB was determined with the preamp off. The result is shown in tables 4 and 5.
|
Table 4. Dynamic range of the TS-2000 receiver. The noise figure was found to be 22.4 dB. |
|
The receiver of the TS-2000 is much better than the transmitter at 50 kHz
frequency separation.
This seems to be typical for amateur radio transceivers,
the local oscillators on modern rigs are sometimes quite good and
that is reflected in the receiver performance but the
transmitters are not designed to take advantage of the quality of
the local oscillator.
This may be because product reviews do not look for this kind
of unwanted radiation - it may be of little significance on the HF
bands, but it could be very important for a 144 MHz station.
Technically it is trivial to cure this problem by changing the gain
distribution in the tx path.
Note that the noise emissions increase when the voice is silent because
ALC increases the gain.
|
Table 5. Dynamic range of the TR7A receiver. The noise figure was found to be 13.4 dB. |
|
The TR7A has similar performance on both transmit and receive,
an observation that indicates that the dynamic range in both
cases is limited by the noise sidebands of the local oscillator.
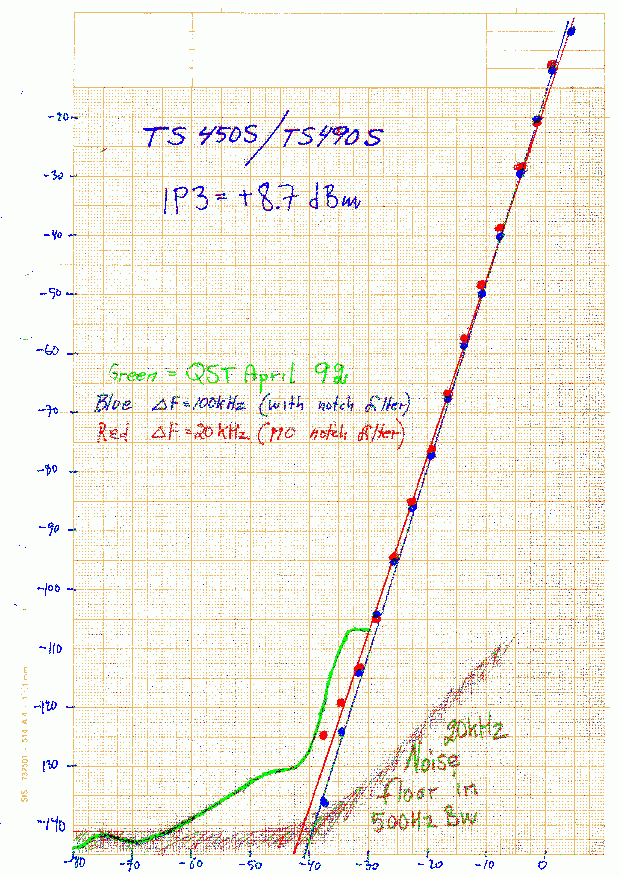
The third order intercept point.The third order intercept point was measured with three signal generators. Two strong signals with equal amplitude plus a third one which was set to be equal in amplitude to the intermodulation product (IM3) in the loudspeaker output.My focus at the RS-03 meeting was the IM3 measurements. The reason is the large discrepancies between IP3 and IM3DR values reported in ARRL product reviews. The question I search for an answer to is: Is IP3 a good number by which we can characterize the sensitivity to intermodulation for a receiver ? Another way to formulate this question is: Is there a level at which and below which the IM3 level follows the third order law? The ARRL product review for the TS-450S is an example of a particularly large deviation from the normal third order law. The result from the RS-03 meeting is that there is definitely not any trace of irregular behaviour at a frequency separation of 100 kHz. The notch filter used at the meeting was not free of intermodulation at 20 kHz separation so the measurement was performed without any notch filter and is therefore not reliable at the very low levels where the irregularity was reported. The IM3 did however disappear in a normal fashion although I did not take notes of the levels. At very poor S/N ratios, the measurement takes some time and knowing the measured level is intermodulation from the generators makes it uninteresting. During the meeting I was unaware the the irregularity was reported at such a very low level, otherwise I had taken the time to get the numbers. From memory I can say that IM3 disappeared in a normal fashion as the signal levels were reduced. My conclusion is that the TS-450S/TS-490S transceivers have been modified. The serial number of the TS-450S tested at ARRL Lab was 30200807 while the unit tested at the RS-03 meeting was 60700160. Another possibillity is that there was some error in the ARRL Lab measurement. A radio with a noise figure of 6 dB and an IP3 of +11 dBm was not common in 1992. It is about 3 dB better than the FT1000D and the IC-781 and measuring third intermodulation at the noise floor of these receivers is not trivial. This link: The third order intermodulation performance of a receiver contains some work done after the RS-03 meeting as a follow-up on the results presented below. It gives a simple theory with some oscilloscope images showing intermodulation waveforms. There is also a discussion about precision measurements and the small deviations from the simple theory that can be observed in the FT1000D.
Third order intermodulation in the TS-450SFigure 2 shows the measured data from the RS-03 meeting compared to the published result from the QST product review. Since three generators were used, AGC does not affect the measurement and the third order intermodulation can be followed up to very high levels. IP3 is found to be about +8.7 dBm.
|

Fig. 2. IM3 in TS-450S. Red points are at 20 kHz and blue points are at 100 kHz frequency separation. The blue line is fitted to the 100 kHz data points while the red line has the theoretically expected 3:1 slope. The data points fit to the third order law with deviations that are compatible with the expected experimental errors. At 20 kHz the generators are not well enough isolated from each other.
|
Third order intermodulation in the TR7AFigure 3 shows the measured data from the RS-03 meeting. The data fits well to a 3:1 line up to a point about 15 dB below IP3, which was found to be about +10.5 dBm. The noise figure was found to be 13.4 dB.
|

Fig. 3. IM3 in TR7A at a frequency separation of 100 kHz.
|
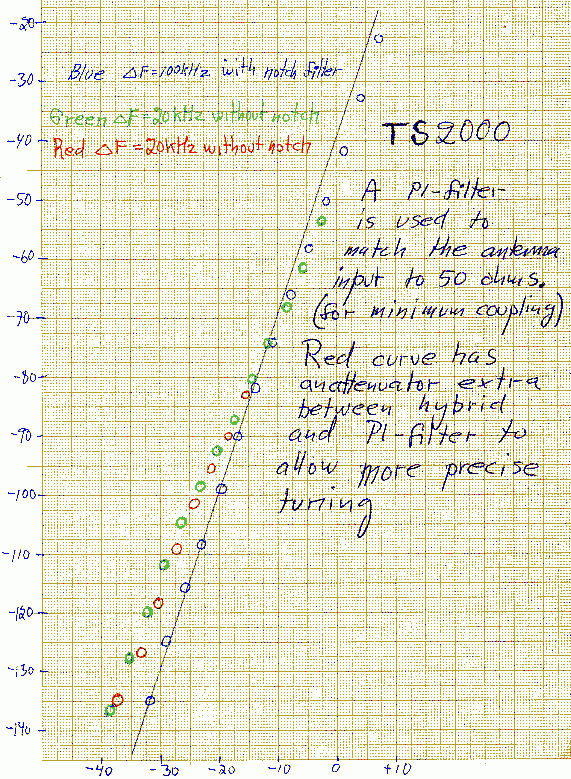
Third order intermodulation in the TS-2000Figure 4 shows the measured data from the RS-03 meeting. A notch filter was used for 100 kHz frequency separation while the measurement at 20 kHz was performed without any notch filter with the signal generators connected to a hybrid which had a matching network at the output. The matching network was tuned for optimum isolation between the generators. A second measurement with a 12 dB attenuator between the hybrid and the matching network made it possible to tune for a better isolation, but since the signal generators then had to deliver 12 dB more power it is questionable whether this would be an improvement. The fact that the two measurements at 20 kHz frequency separation differs is an indication that the setup was not good enough for measurements at 20 kHz frequency separation.The 100 kHz data fits well to a 3:1 line up to a point about 30 dB below IP3, which was found to be about +20 dBm. The data for 20 kHz frequency separation shows a significant discrepancy with the 3:1 slope but the reason is partly intermodulation in the signal generators. The TS2000 itself is probably not contributing to the deviations from the third order law. The noise figure was found to be 22.4 dB.
|

Fig. 4. IM3 in TS-2000. Blue circles are for 100 kHz while red and green are for 20 kHz frequency separation. The fact that the red and green circles do not fall on a common line is an indication that the test signal is not ok. This is not unexpected. See text.
|
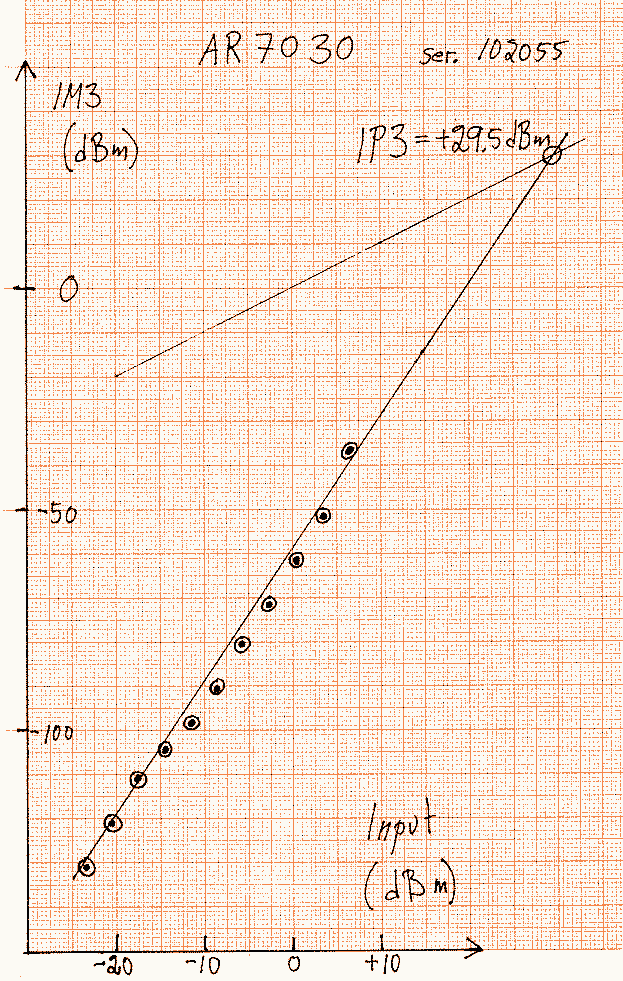
Third order intermodulation in the AR7030Figure 5 shows the measured data from the RS-03 meeting. The data does not fit too well to a 3:1 line. The reason is unknown, but may well be found in the notch filters. Quartz crystals do produce some third order intermodulation and I do not know whether it might contribute at the high signal levels required to produce IM3 in the AR7030. The deviations are not large enough to invalidate IP3 as a good number for characterization of this receiver. Extrapolation from low levels (below -15 dBm input) gives IP3 = 29.5 dBm.
|

Fig. 5. IM3 in AR7030 at a frequency separation of 100 kHz.
|
| To SM 5 BSZ Main Page |