|
Here are the links to
Linrad Home Page
and to the
WSE converters
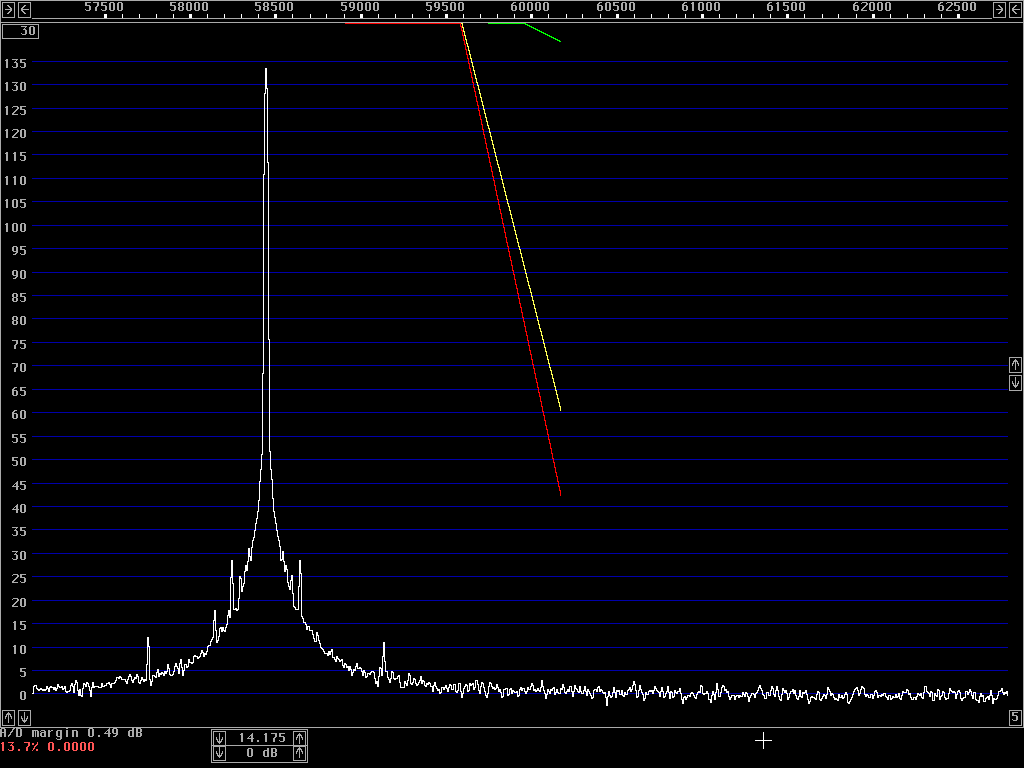
The two first spectra on this page were omtained with a 14 .16 MHz crystal oscillator and a HP8657A signal generator respectively. The generator under test was connected to the input of the WSE converter chain and Linrad was run in txtest mode with these parameters: First FFT bandwidth (Hz) [20] First FFT window (power of sin) [9] First forward FFT version [2] First FFT storage time (s) [30] First FFT amplitude [1000] The bin bandwidth becomes about 12 Hz with these settings. Fig. 1 shows the spectrum of a low noise crystal oscillator. |

|
|
Fig.1. Linrad/WSE spectrum display of a crystal oscillator on 14 MHz. The bandwidth is about 12 Hz As can be seen from fig. 1, the saturation limit is at 134 dB on the dB scale. The signal is only 0.49 dB from saturation as can be seen in the lower left corner. At a frequency separation of 1 kHz, the noise floor is at about 1 dB which means that the noise floor is at about -144 dBc/Hz at a frequency separation of 1 kHz. As a comparison, fig. 2 shows the signal from a HP8657A signal generator that was set for the same frequency and signal level. |

|
|
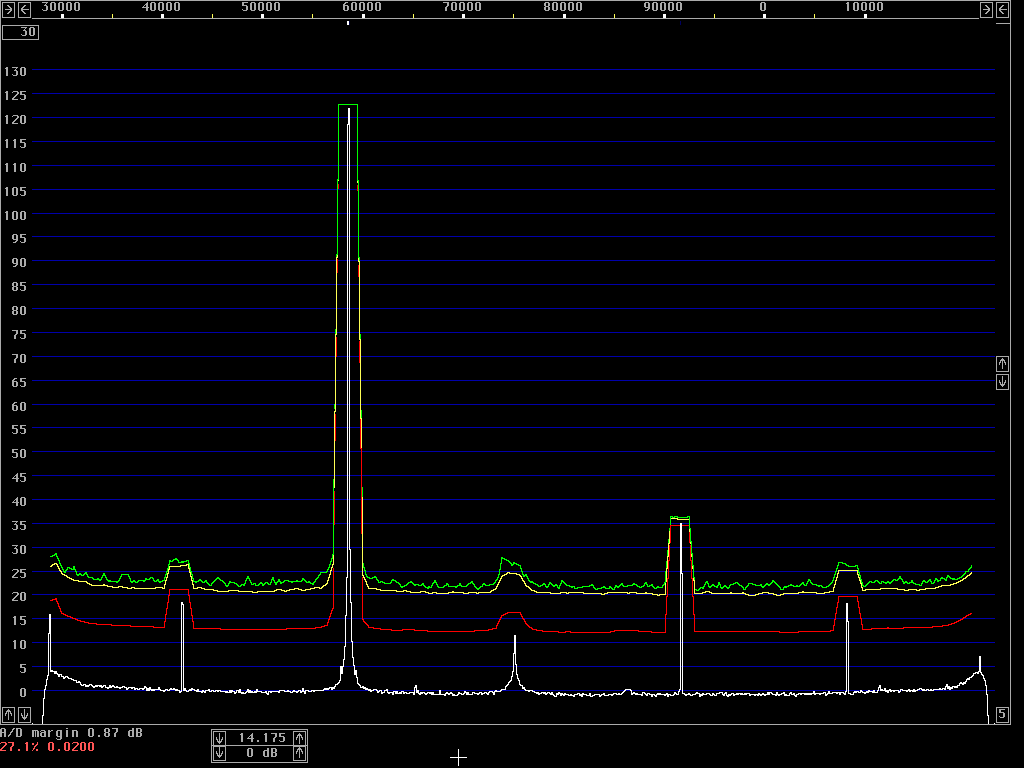
Fig.2. Linrad/WSE spectrum display of a HP8657A signal generator on 14 MHz. All settings identical to fig. 1. A comparison of the two images shows that the HP signal generator produces about 40 dB more noise at a frequency separation of 1 kHz. This is in good agreement with the performance specifications from the manufacturer. Figure 3 shows the entire passband of the WSE/Linrad system. This image is obtained by zooming out from the settings of fig 1. |

|
|
Fig.3. The zoomed out spectrum of the crystal oscillator in figure 1. In fig. 3 the bandwidth is 2.40 kHz with good accuracy. At a frequency separation of 20 kHz the noise floor is at about 12.5 dB while the carrier is at 122.5 dB. These numbers come from the red curve in fig. 3 which shows the average power in 2.4 kHz bandwidth. The margin to saturation is nearly 1 dB (0.87) so the noise floor is at about -145dBc/Hz. The signal level at the antenna input is -8 dBm. The strongest spur is the mirror image. The RX2500 uses direct conversion and the level of the mirror image spur is typically suppressed by 80 dB or more on a calibrated system. The spur at 14.175 MHz is the 1/F noise of the Delta44. Note the way the shape of this peak differs from other signals in the spectrum. The second harmonic spurs generated mainly in the Delta44 are suppressed by more than 100 dB and the third harmonic a little more. To SM 5 BSZ Main Page |